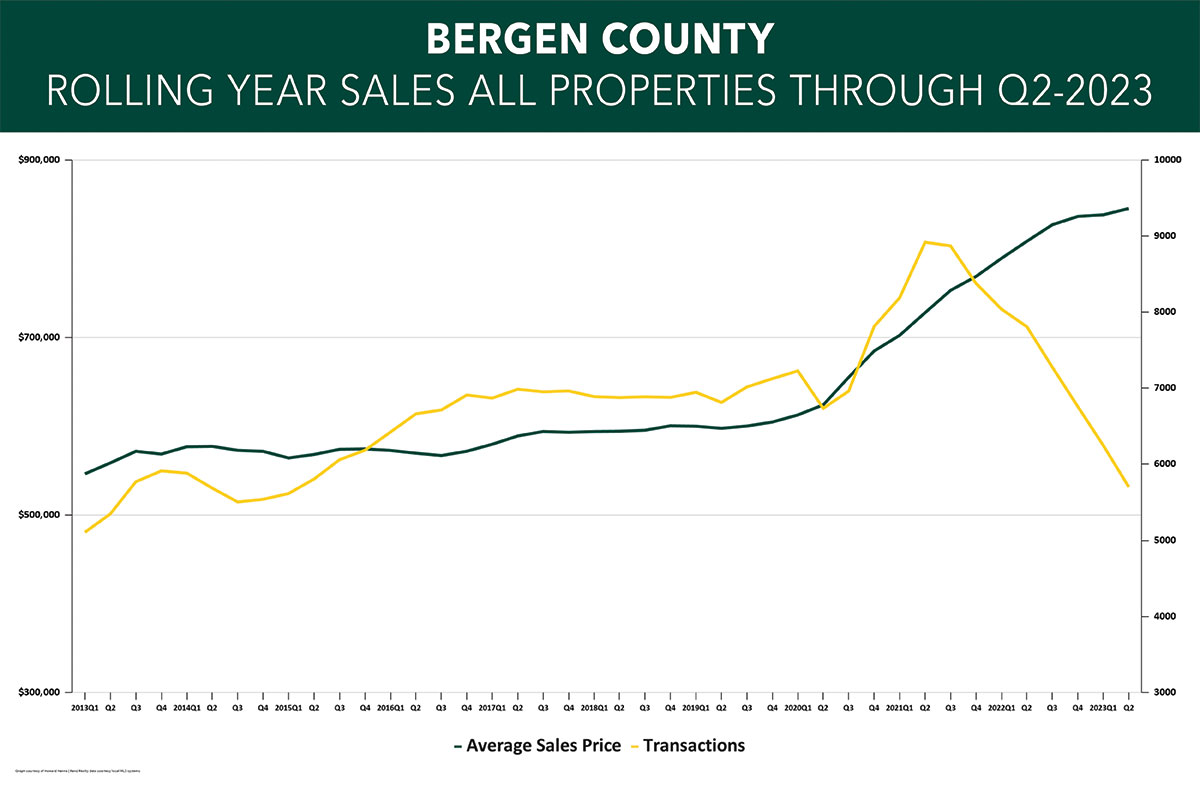


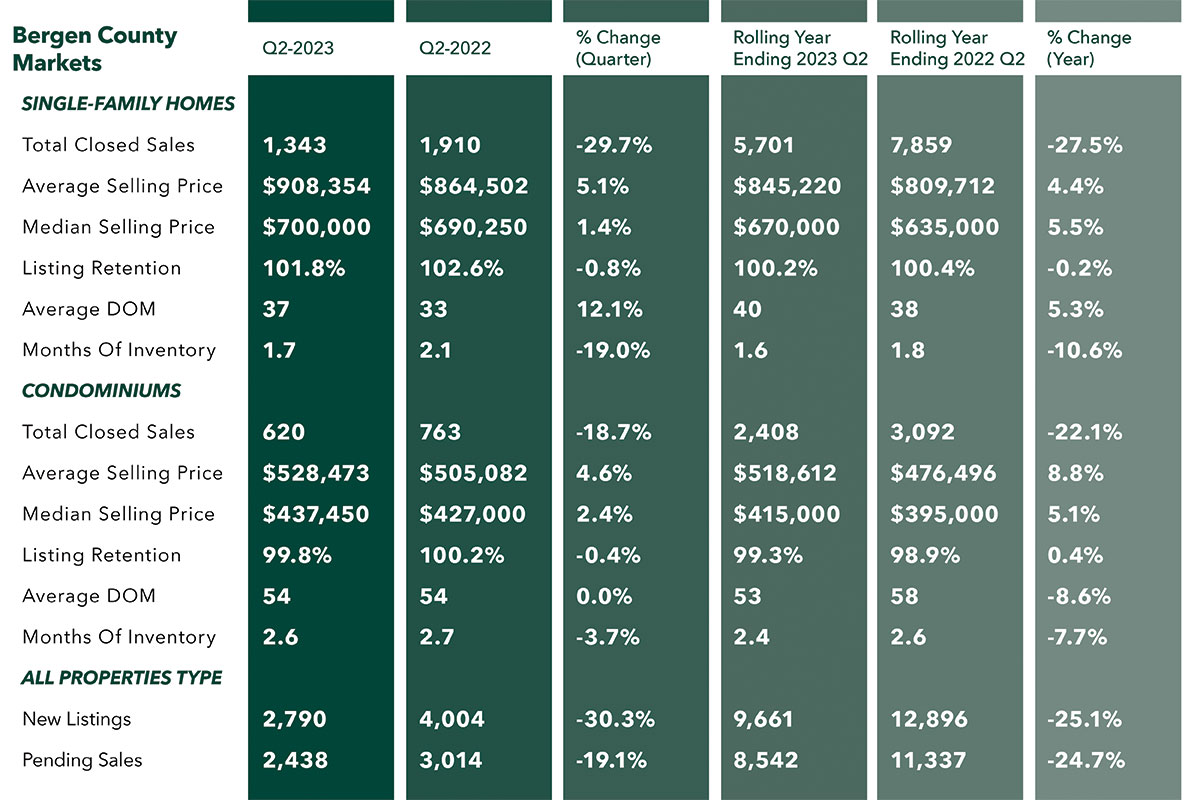
Sales in the Bergen County market fell again in the second quarter of 2023, but prices continued to hit all-time highs.
Bergen County single-family home sales fell significantly, dropping 29.7% from last year’s second quarter and now down 27.5% for the rolling year. Similarly, condo closings were down 18.7% for the quarter and 22.1% for the year. And pending sales, which are a leading indicator of future closings, were down 19.1% for the quarter and 24.7% for the year. We should note that we are comparing against a quarter and rolling year that were at the very tail end of a historic housing bull market, so part of the decline is because we’re measuring off an all-time high baseline.
Indeed, these continued transactional declines have not had any meaningful impact on prices, which again hit an all-time high. Single-family home prices for the quarter were up 5.1% on average and 1.4% at the median, and are now up 4.4% on average and 5.5% at the median for the year. It’s the same story with condos, with prices up 4.6% on average and 2.4% at the median for the quarter, and up 8.8% on average and 5.1.% for the year.
The big story in Bergen is a severe lack of homes for sale, with the months of inventory at historic lows: 1.7 months for single-family homes and 2.6 months for condos. These inventory levels are well below the 6.0 level that signals a “balanced” market. And we don’t see any relief in sight, with new listings down 30.3% from last year’s already-depressed second quarter.
Going forward, we expect these low levels of inventory to continue to put some upward pressure on prices even while they restrict sales totals through the end of the year.


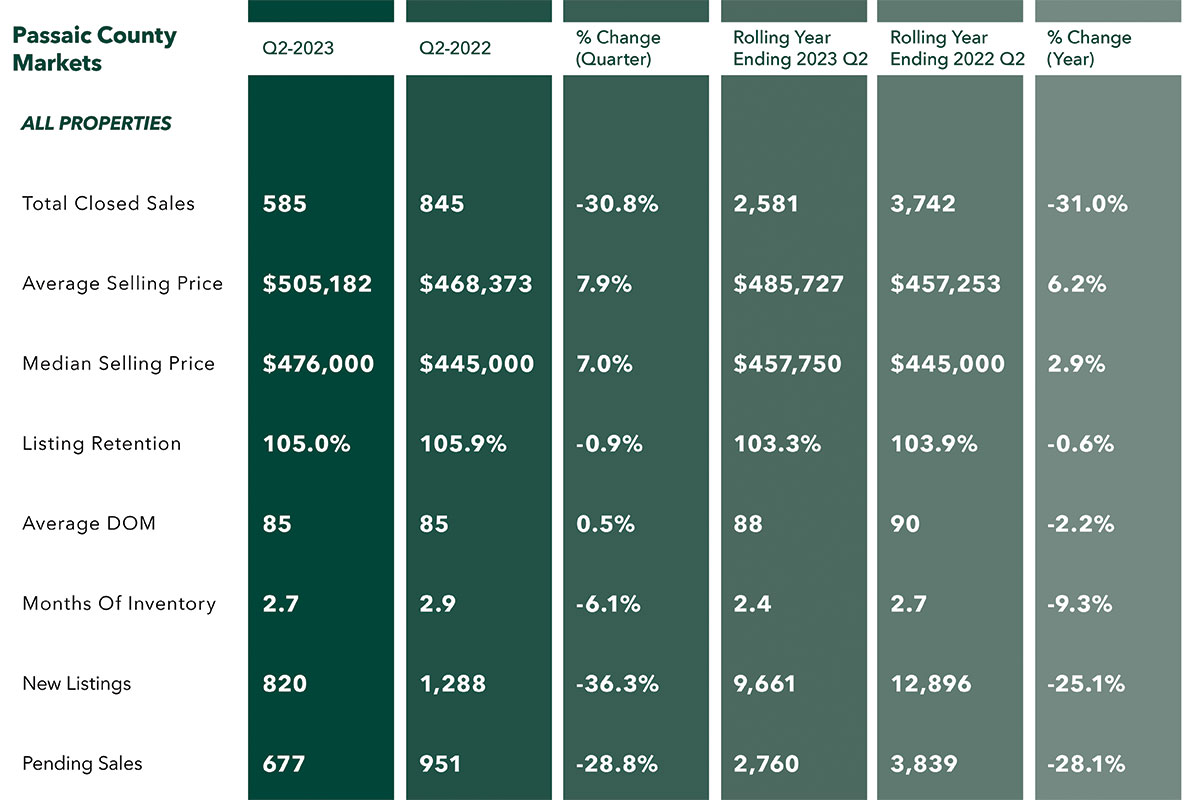
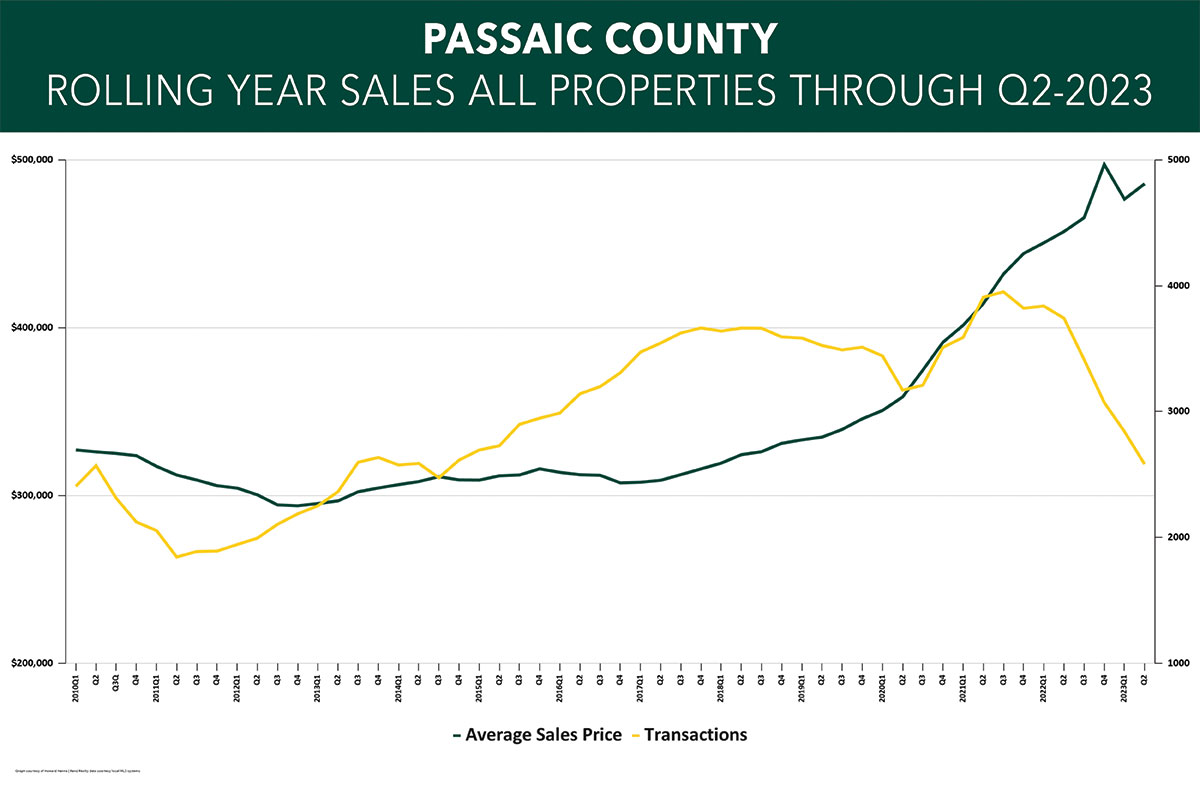
Sales in the Passaic County housing market dropped again in the second quarter of 2023, even while prices continued to hit all time-highs.
Passaic County sales activity was down sharply compared to last year’s second quarter, with closings down 30.8% and pending sales down 28.8%. And for the rolling year, closings were down 31.0% and pendings down 28.1%. We should note that we are comparing against a quarter and rolling year that were at the very tail end of a historic housing bull market, so part of the decline is because we’re measuring off an all-time high baseline. Accordingly, we are likely to see sales start to stabilize compared to last year’s numbers, simply because we will have a lower baseline to clear.
Even with sales falling, though, prices continued to rise, with prices up 7.9% on average and 7.0% at the median. And for the rolling year, prices were up 6.2% on average and 2.9% at the median. Prices are still going up because of the severely low levels of inventory, which is driving buyer competition even with demand diminished by higher interest rates. Passaic had only 2.7 months of inventory available at the end of the quarter, well below the six-month level that marks a “balanced market.” That’s why we are seeing sales go down while prices go up – we have too many buyers chasing too few homes for sale. And we don’t see any relief in sight, with new listings down 36.3% compared to last year’s second quarter.
Going forward, we do believe we will eventually see sales stabilize at last year’s levels, and that low levels of inventory will likely continue to push prices up through the end of the year.


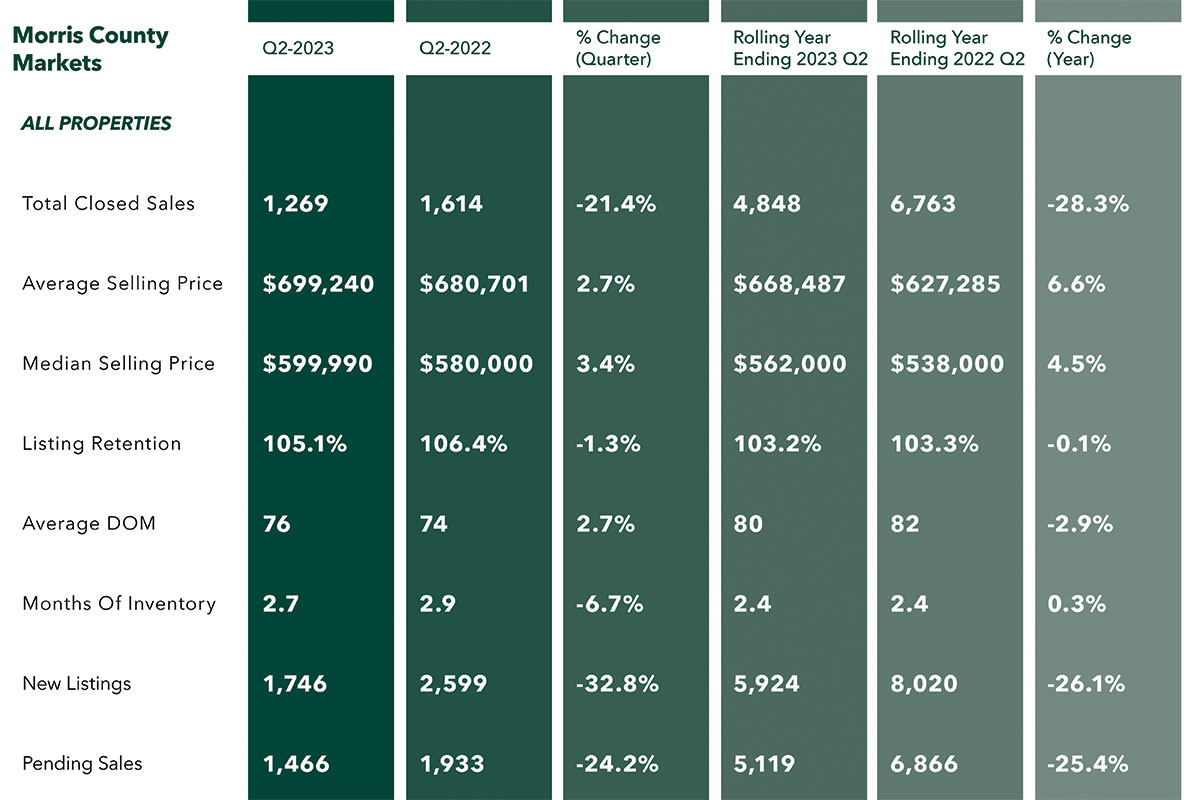
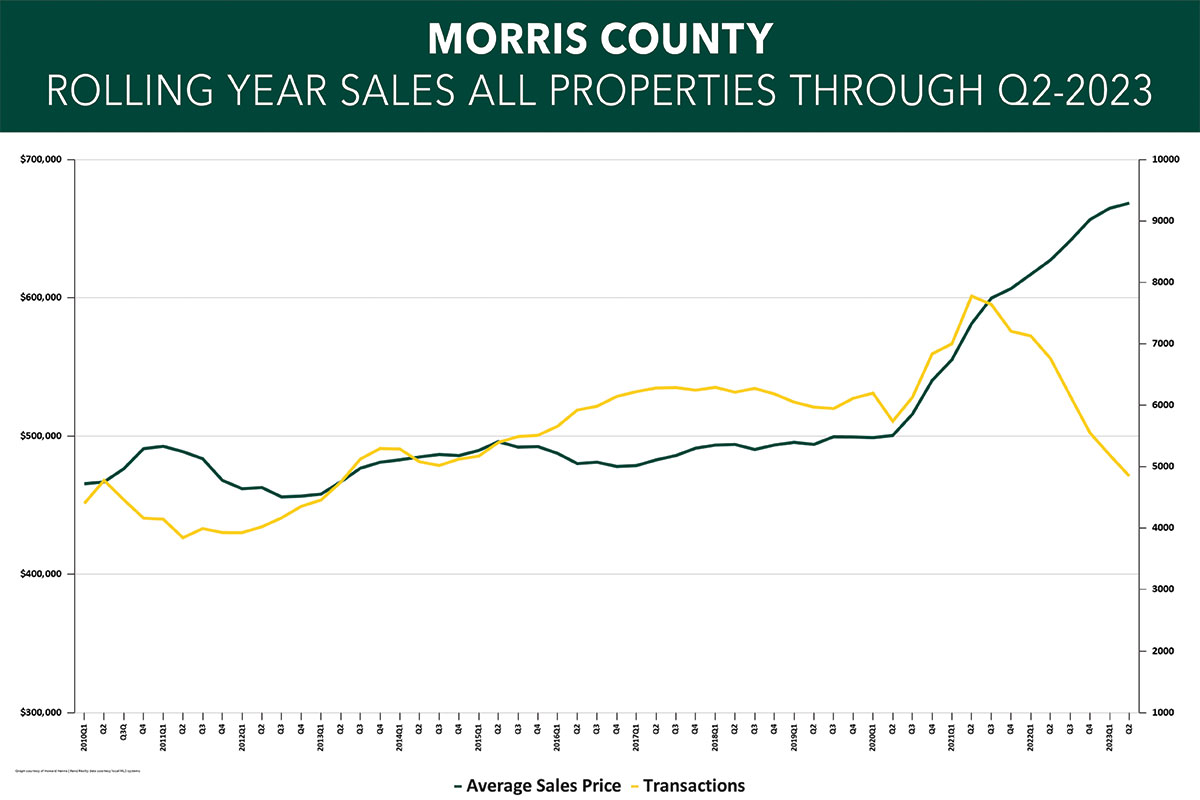
Activity in the Morris County housing market dropped again in the second quarter of 2023, but the decline in closed and pending sales did not keep prices from reaching another historic high.
Morris County sales activity was down sharply, with closings down 21.4% for the quarter and 28.3% for the rolling year. Similarly, pending sales, which are a leading indicator to future closings, were down 24.2% for the quarter and 25.4% for the rolling year. We should note that we are comparing against a quarter and rolling year that were at the very tail end of a historic housing bull market, so part of the decline is because we’re measuring off an all-time high baseline. Accordingly, we are likely to see sales start to stabilize compared to last year’s numbers, simply because we will have a lower baseline to clear.
But the decline in sales has not affected prices, which continued to rise. Prices were up 2.7% on average and 3.4% at the median for the quarter and up 6.6% for on average and 4.5% at the median for the rolling year. We believe prices are still going up mostly due to the lack of inventory for sale, which is still driving buyer competition even with lower levels of demand. Morris had only 2.7 months of inventory available at the end of the quarter, well below the six-month level that marks a “balanced market.” That’s why we are seeing sales go down while prices go up – we have too many buyers chasing too few homes for sale. And we don’t see any relief in sight, with new listings down 32.8% compared to last year’s second quarter.
Going forward, we do believe we will eventually see sales stabilize near last year’s levels, and that low levels of inventory will likely continue to push prices up through the end of the year.


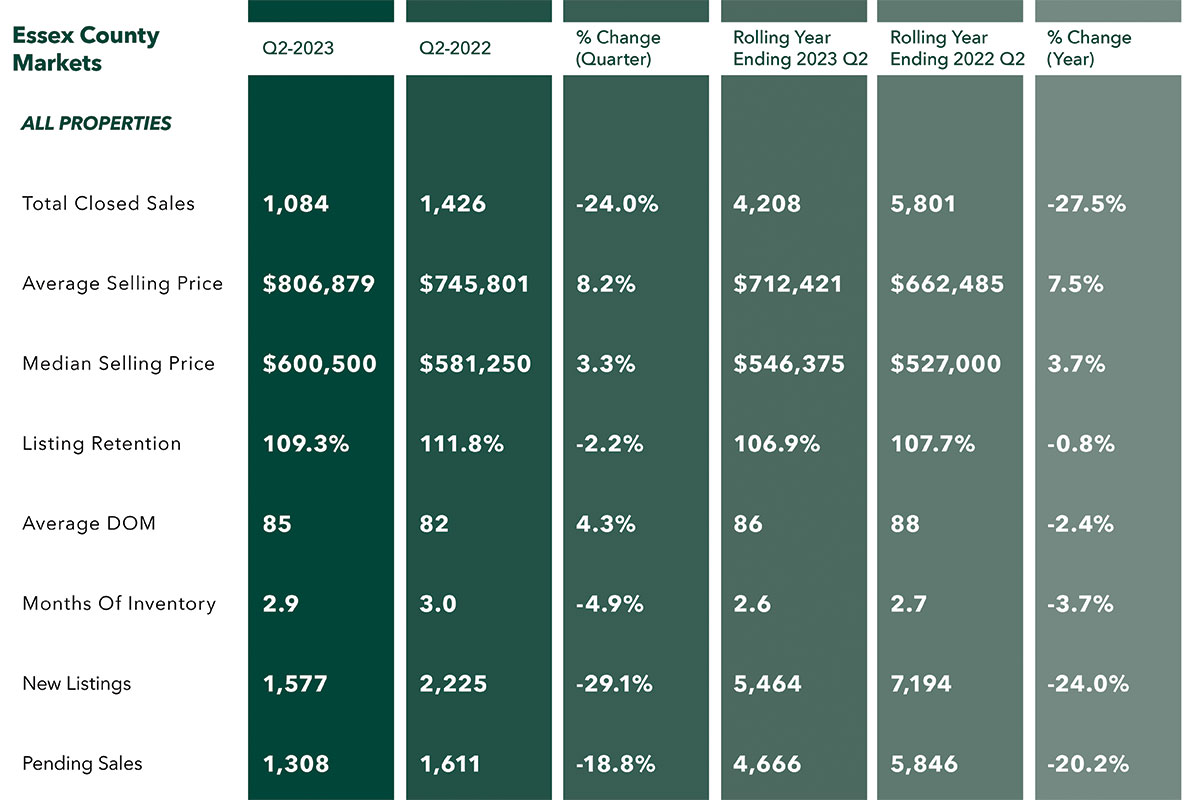
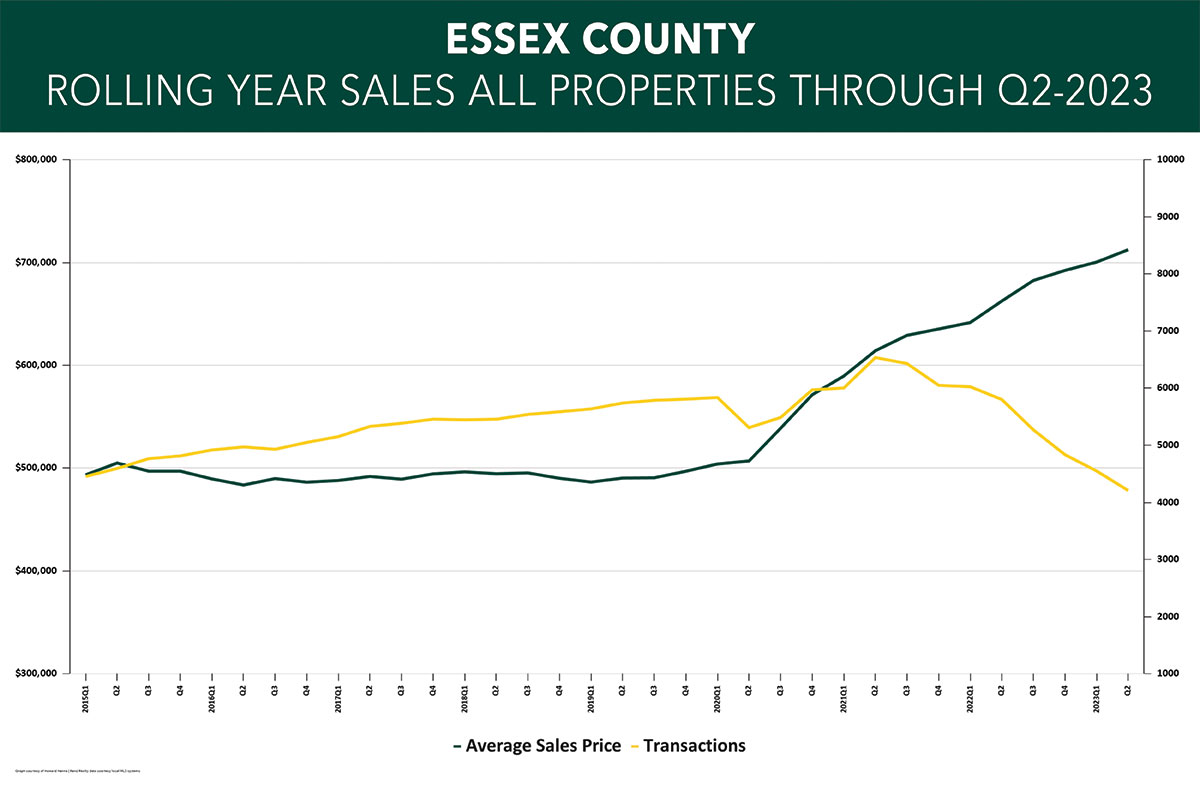
The Essex County housing market slowed in the second quarter of 2023, but pricing reached an historic high.
Essex County closings were down dramatically, falling 24.0% for the quarter and 27.5% for the rolling year. Similarly, pending sales, which are a leading indicator to future closings, were down 18.8% for the quarter and 20.2% for the rolling year. That said, we are comparing against the very tail end of a historic housing bull market, so part of the decline is because we’re measuring off an all-time high baseline. Accordingly, we are likely to see sales start to stabilize compared to last year’s numbers, simply because we will have a lower baseline to clear.
But the decline in sales has not affected prices, which continued to rise. Prices were up a whopping 8.2% on average and 3.3% at the median for the quarter and 7.5% on average and 3.7% at the median for the rolling year. Prices are still going up because Essex simply does not have enough homes for sale, which is still driving buyer competition even with lower levels of demand suppressed by higher interest rates. Essex had only 2.7 months of inventory available at the end of the quarter, well below the six-month level that marks a “balanced market.” Essentially, we have too many buyers chasing too few homes for sale. And the situation will not get better anytime soon, with new listings down 29.1% compared to last year’s second quarter.
Going forward, we do believe we will eventually see sales stabilize near last year’s levels, and that low levels of inventory will continue to push prices up through the end of the year.


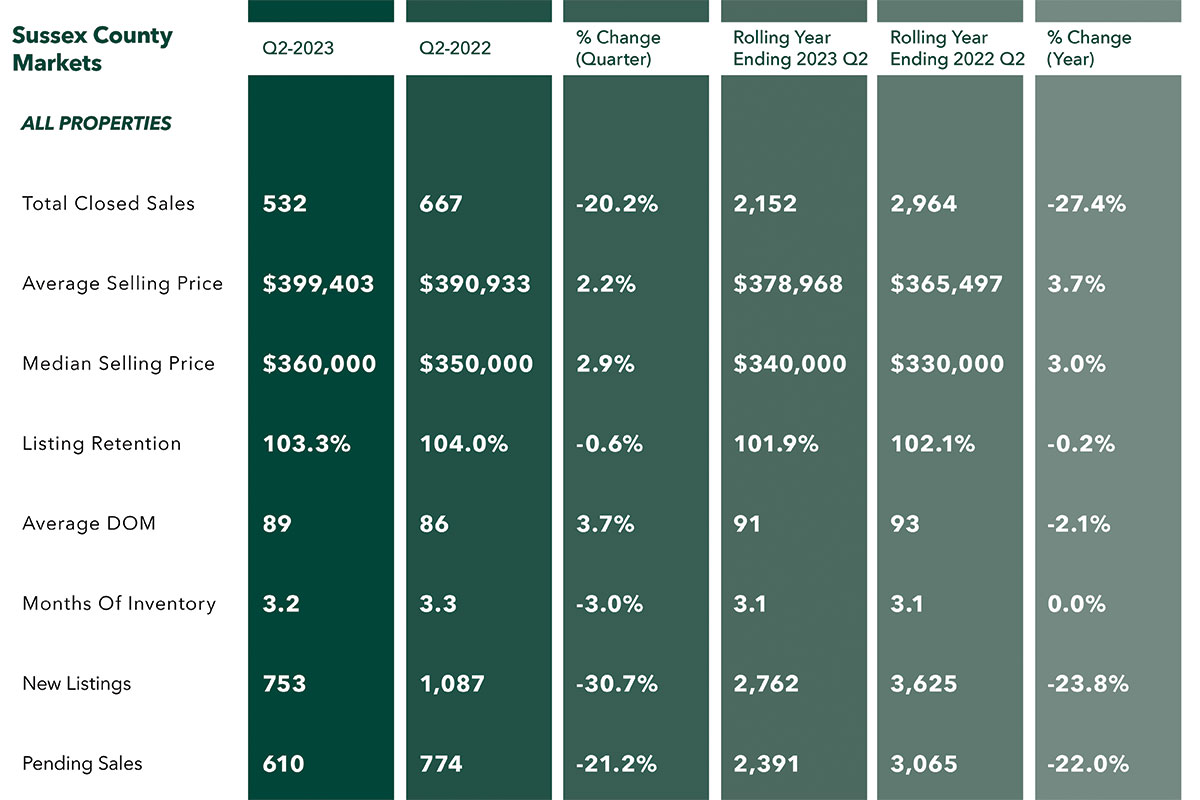
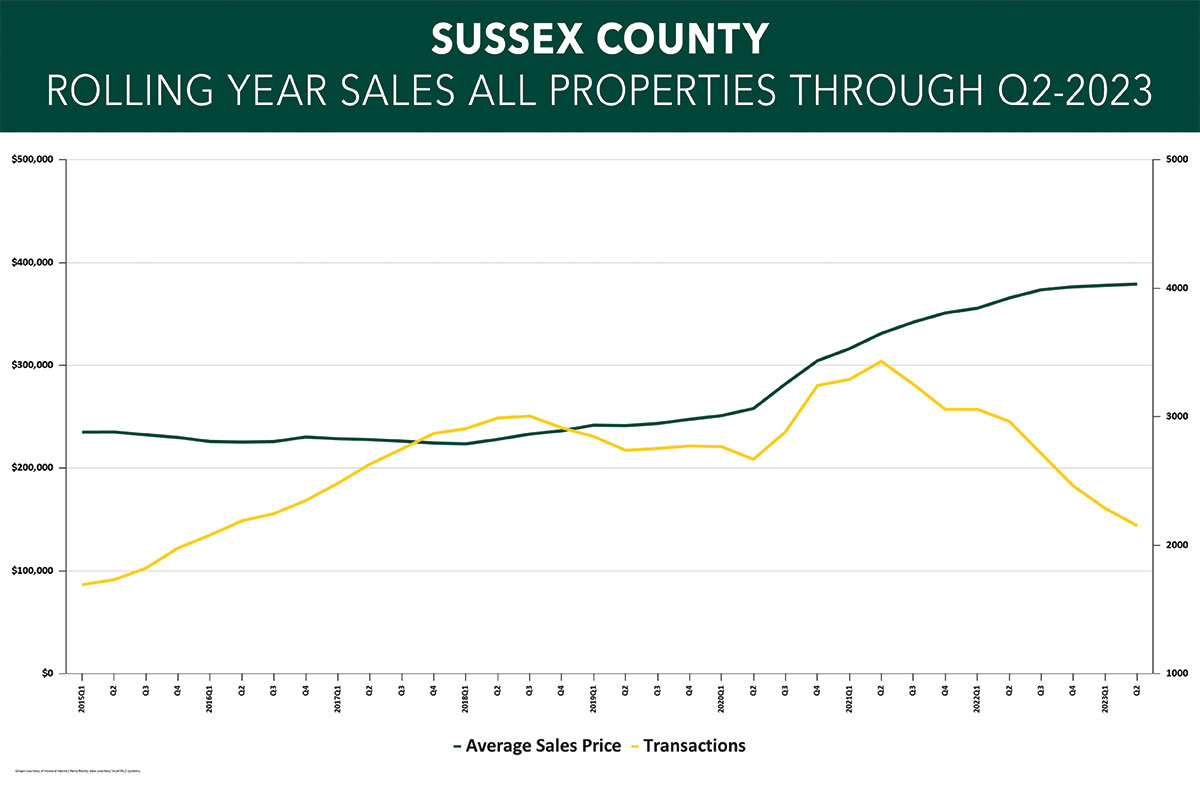
Sales in the Sussex County market continued to decline in the second quarter of 2023, but prices reached historic highs.
Like the other counties in the region, Sussex County closed sales fell dramatically from last year, dropping 20.2% for the quarter and 27.4% for the rolling year. And pending sales, which are a leading indicator of future closings, were down 21.2% for the quarter and 22.0% for the year. We should note that we are comparing against a quarter and rolling year that were at the very tail end of a historic housing bull market, so part of the decline is because we’re measuring off an all-time high baseline. Accordingly, we are likely to eventually see sales start to stabilize compared to last year’s numbers, simply because we will have a lower baseline to clear.
Even with sales down, though, prices went up, reaching historic heights and recovering from a slight stumble in the first quarter. Prices were up 2.2% on average and 2.9% at the median for the quarter, and are now up 3.7% on average and 3.0% at the median for the rolling year. Prices are still rising because of Sussex’s severe lack of inventory, with the months of inventory leveling off at 3.2 months, well below the 6.0 level that signals a “balanced” market. We still have too many buyers chasing that minimal inventory. And we don’t see any relief in sight, with new listings down 30.7% from last year’s already-depressed second quarter.
Going forward, we do believe we will see sales stabilize at last year’s levels, and that low levels of inventory will continue to drive some price appreciation through the end of the year.


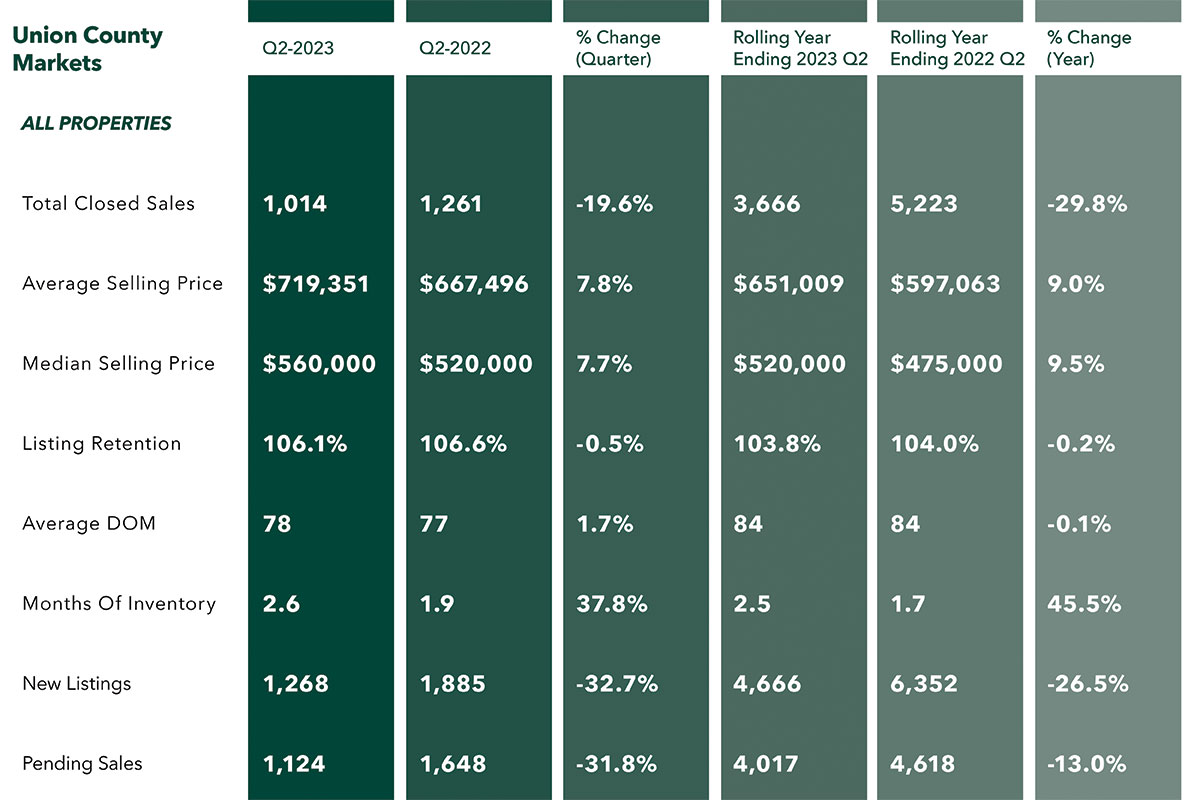
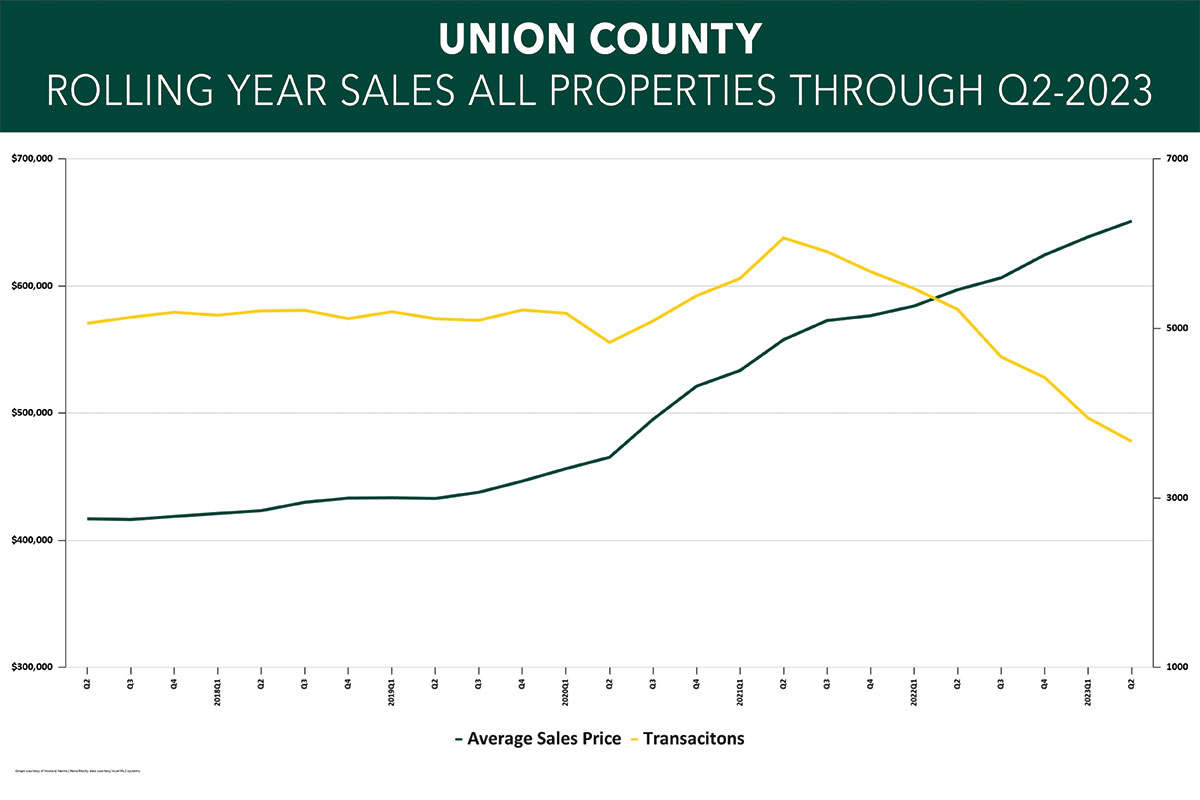
Sales in the Union County housing market fell again in the second quarter of 2023, but prices continued to hit all-time highs.
Sales activity in Union was down dramatically, with closings falling 19.6% for the quarter and now down 29.8% for the rolling year. Similarly, pending sales, which are a leading indicator to future closings, were down 31.8% for the quarter and 13.0% for the rolling year. We should note that we are comparing against a quarter and rolling year that were at the very tail end of a historic housing bull market, so part of the decline is because we’re measuring off an all-time high baseline. Accordingly, we are likely to eventually see sales start to stabilize compared to last year’s numbers, simply because we will have a lower baseline to clear.
But even with this decline in sales, prices continued to reach all-time highs. Prices were up 7.8% on average and 7.7% at the median for the quarter and are now up 9.0% on average and 9.5% at the median for the rolling year. We believe prices are still going up mostly due to the severe lack of inventory. Morris had only 2.6 months of inventory available at the end of the quarter, well below the six-month level that marks a “balanced market.” Basically, we have too many buyers chasing too few homes for sale. And we don’t see any relief in sight, with new listings down 32.7% compared to last year’s first quarter.
Going forward, we do believe we will see sales stabilize at last year’s levels, and that low levels of inventory will continue to drive price appreciation through the end of the year.


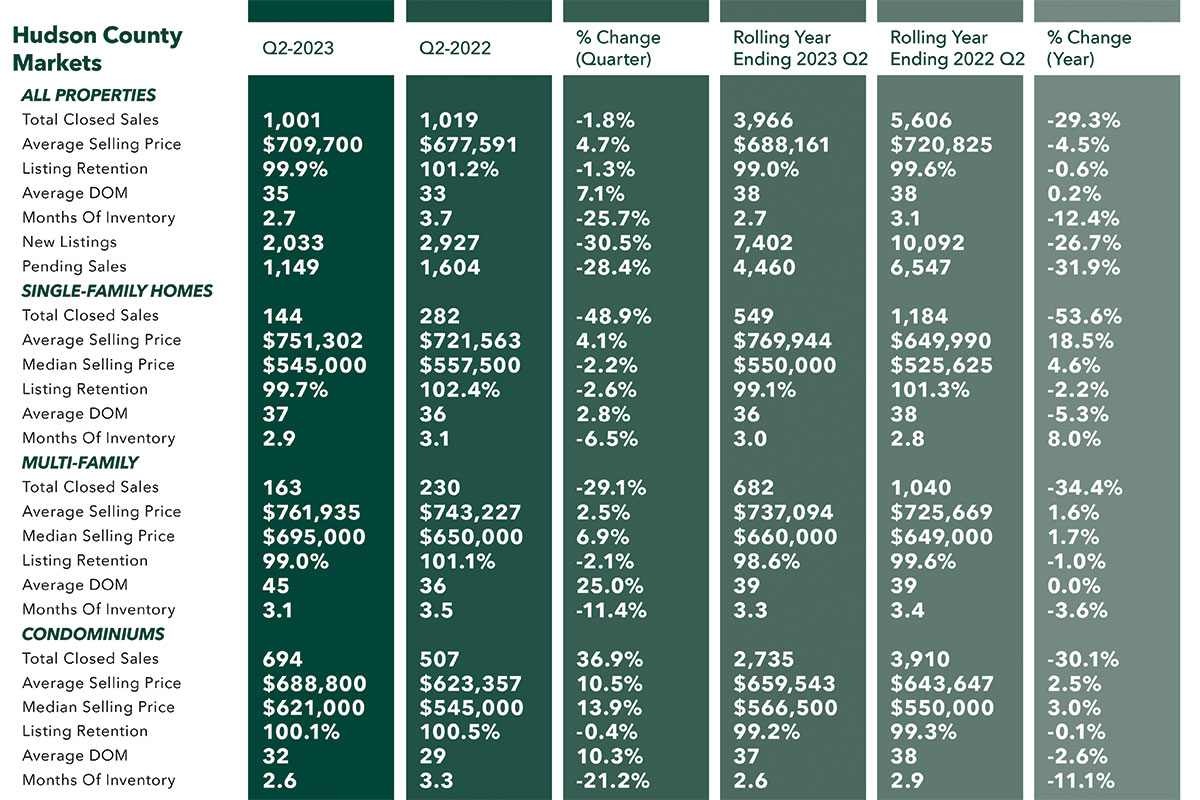
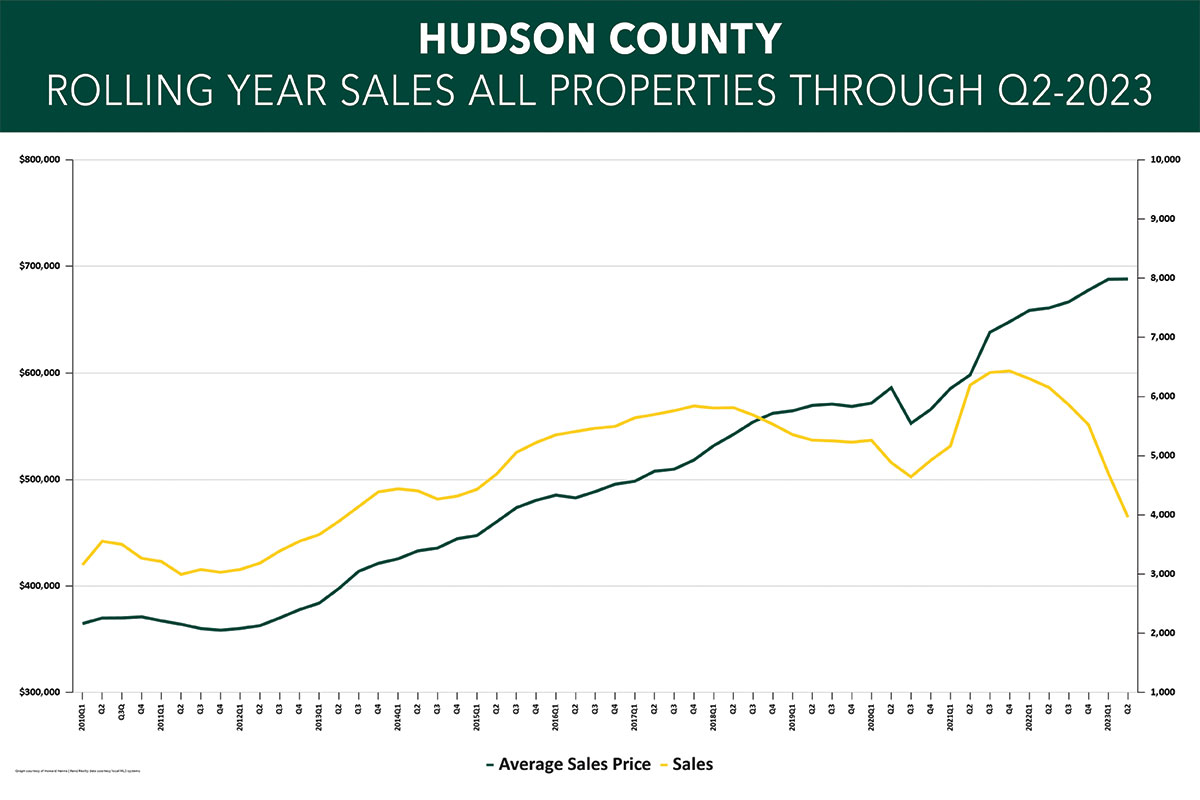
The Hudson County housing market stumbled through the second quarter, with dramatic drops in sales and some mixed results in pricing.
Overall, sales were down 34.6% compared to last year’s second quarter, consistent with other counties in the region. Transactions fell across the board, dropping 30.8% for single-family homes, 27.9% for multi-families, and 36.7% for condos. The market has now clearly transitioned from the post-pandemic surge, with sales now down 30.8% overall for the full rolling year. We should note that we are comparing against a quarter and rolling year that were at the very tail end of a historic housing bull market, so part of the decline is because we’re measuring off an all-time high baseline. But the softening of the Manhattan market has clearly spread to the adjacent urban markets along the Gold Coast.
Prices were mixed. The average price for the county was up 2.7%, but the results were mixed depending on property type: Single-family home average prices fell 1.3% on average and 6.8% at the median, while multi-family prices were up 3.3% on average and 2.8% at the median and condo prices were up 3.0% on average and 6.0% at the median. For the rolling year, though, average prices up 6.8% for all property types together, largely driven by a 14.7% average price increase in single-family homes.
Why are prices going up while sales go down? Simply put, it’s the lack of inventory. Hudson County now has 2.7 months of inventory across property types, well below the 6.0 month level that marks a balanced market.
Going forward, we expect sales to stabilize at their currently levels, and that prices will continue to hold up so long as inventory stays low.


