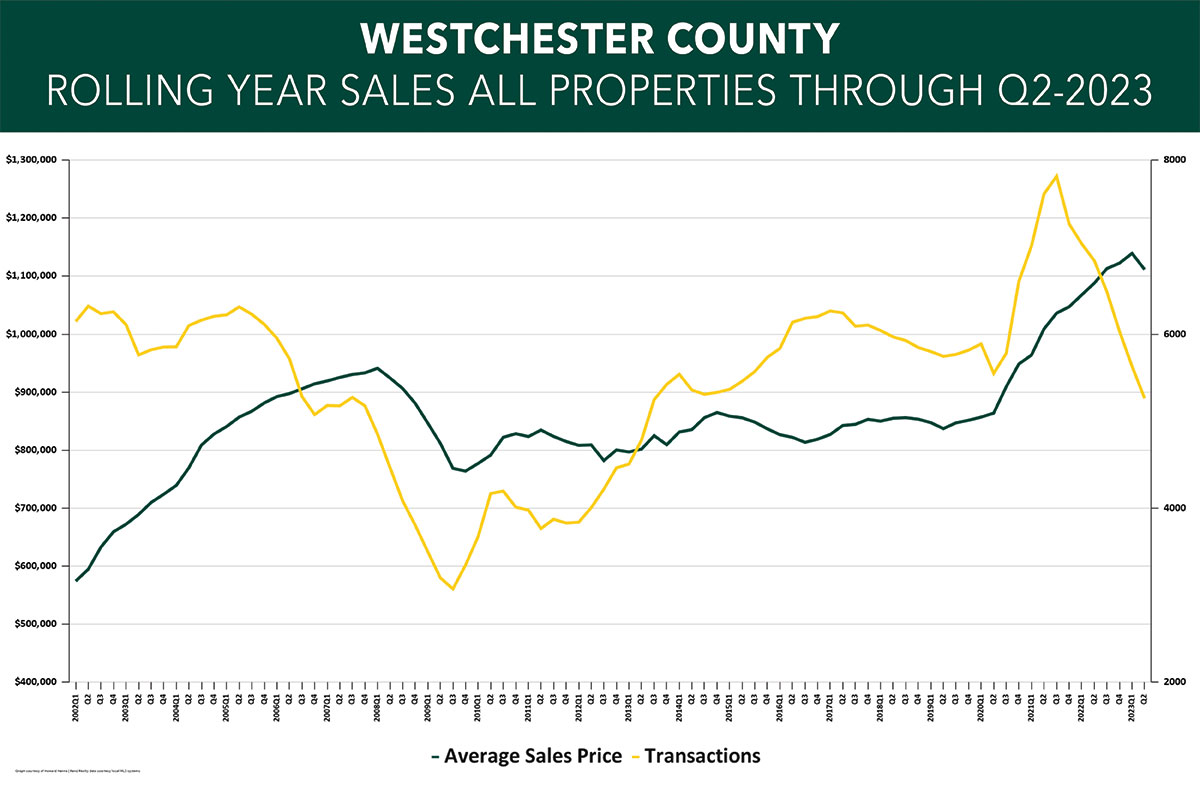


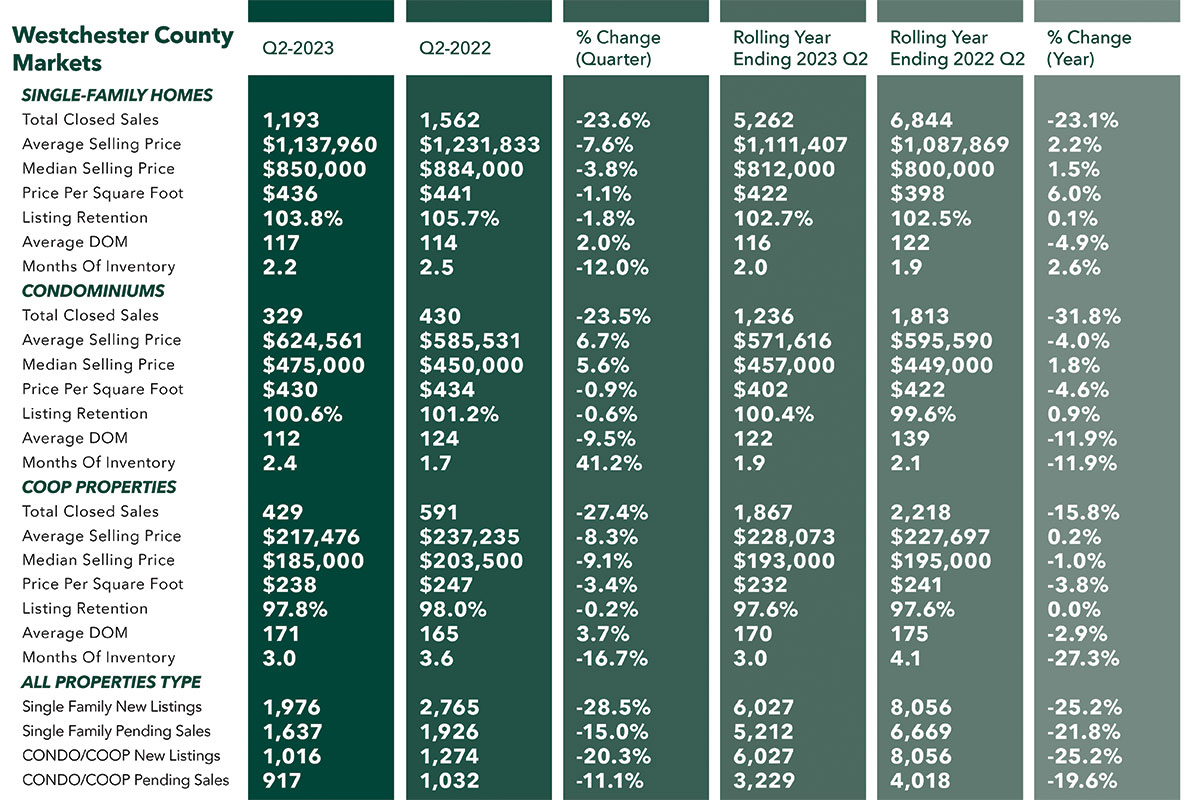
Westchester County sales were down sharply from last year’s second quarter, while prices showed the first signs of coming down off their historic highs.
Transactions were down sharply compared to last year’s second quarter, falling 23.6% for single-family homes, 27.4% for co-ops, and 23.5% for condos. And for the year, sales were down 23.1% for single-family, 15.8% for co-ops, and 31.8% for condos. Moreover, pending sales, which are a leading indicator of future closings, were also down, falling 15% for single-family homes and 11.1% for condos and co-ops combined. These declining sales have started to show the first signs of impacting pricing, which was mixed, with average prices down for single-family homes and coops but up for condos.
One major challenge in Westchester is the severe lack of supply, with the months of inventory leveling off at 2.2 months for single-family homes, 3.0 months for co-ops, and 2.4 months for condos. Those results are all well below the 6.0 level that signals a “balanced” market. And there’s no relief in sight, with new listings in the second quarter down sharply for all property types: down 28.5% for single-family homes and 20.3% for condos and coops combined.
Going forward, we believe that sales will start to level off compared to last year’s results, and that prices will stabilize near their current highs.


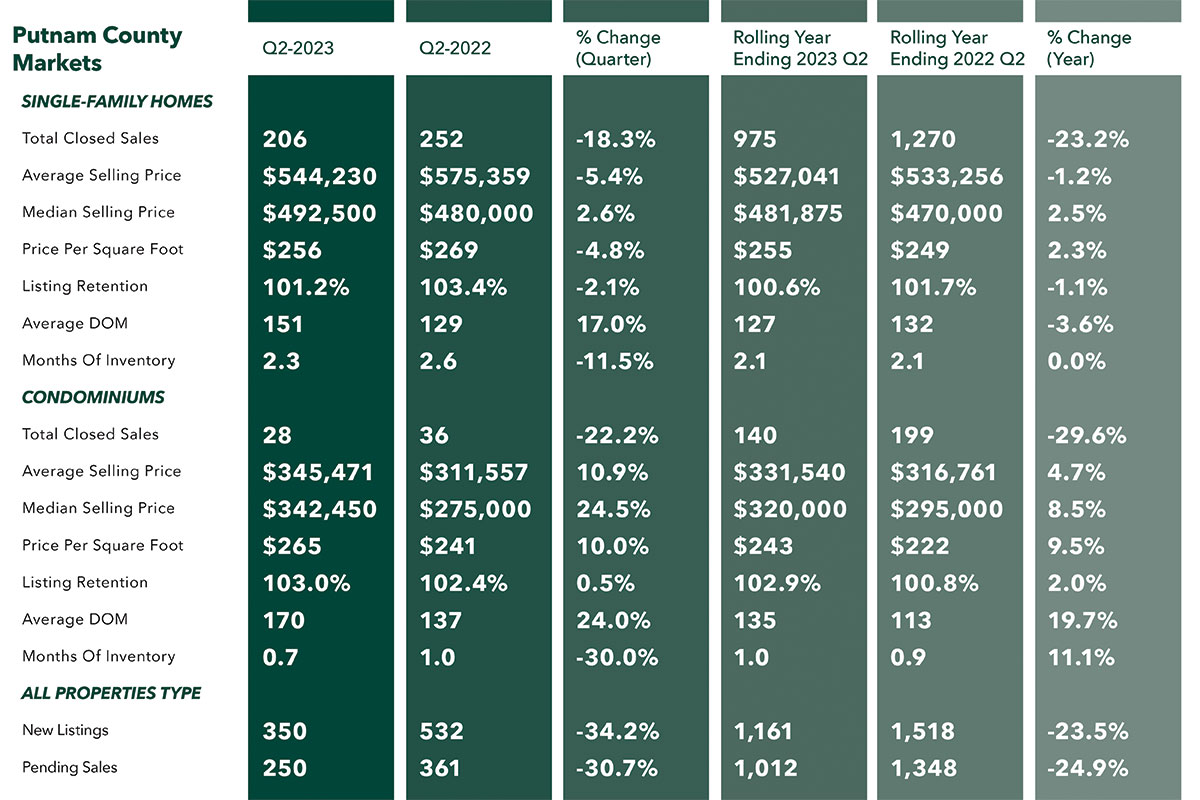
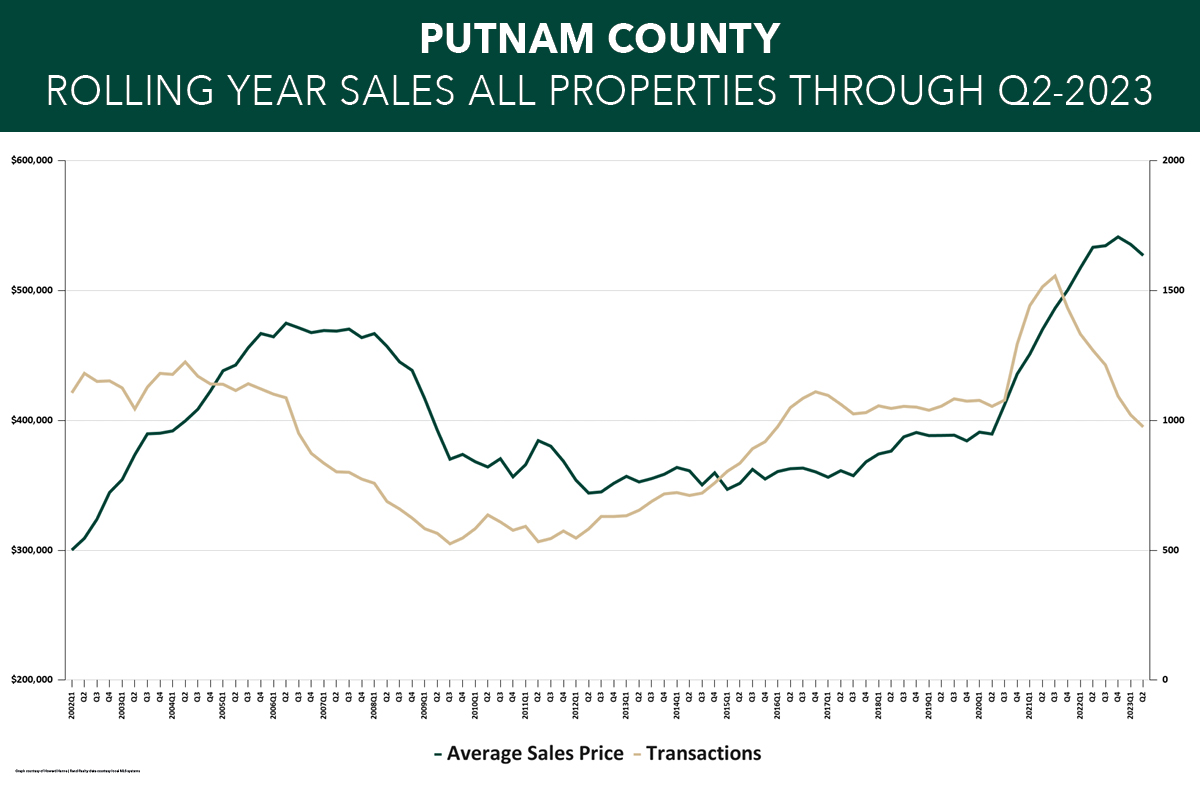
The Putnam County housing market continued to slow in the second quarter of 2023, with declines in sales and mixed results in prices
Closings were down across the board, falling 18.3% for single-family homes and 22.2% for condos compared to last year’s second quarter. Sales were also down for the rolling year, falling 23.2% for single-family and 29.6% for condos. Even more significantly, pending sales, which are a leading indicator, were down 30.7%% for the quarter and 24.9% for the rolling year. We do expect sales will at some point stabilize at last year’s levels now that we’re no longer measuring off the heights of the 2020-22 bull market, but we’re likely to see sales at 2014-15 levels for the rest of the year.
These declining sales are having some impact on pricing. Single-family home prices were down 5.4% on average for the quarter and 1.2% for the rolling year. But median prices were up slightly for both the quarter and the year, and the entry-level condo prices were up sharply.
Putnam’s supply of housing for sale continues to be a problem, with the months of inventory leveling off at 2.3 months for single-family homes and a ridiculous 0.7 months for condos. Those results are all well below the 6.0 level that signals a “balanced” market. And there’s no relief in sight, with new listings in the second quarter down 34.2% from last year’s depressed levels.
Going forward, we believe that sales will start to level off compared to last year’s results, and that prices will stabilize near their current levels.


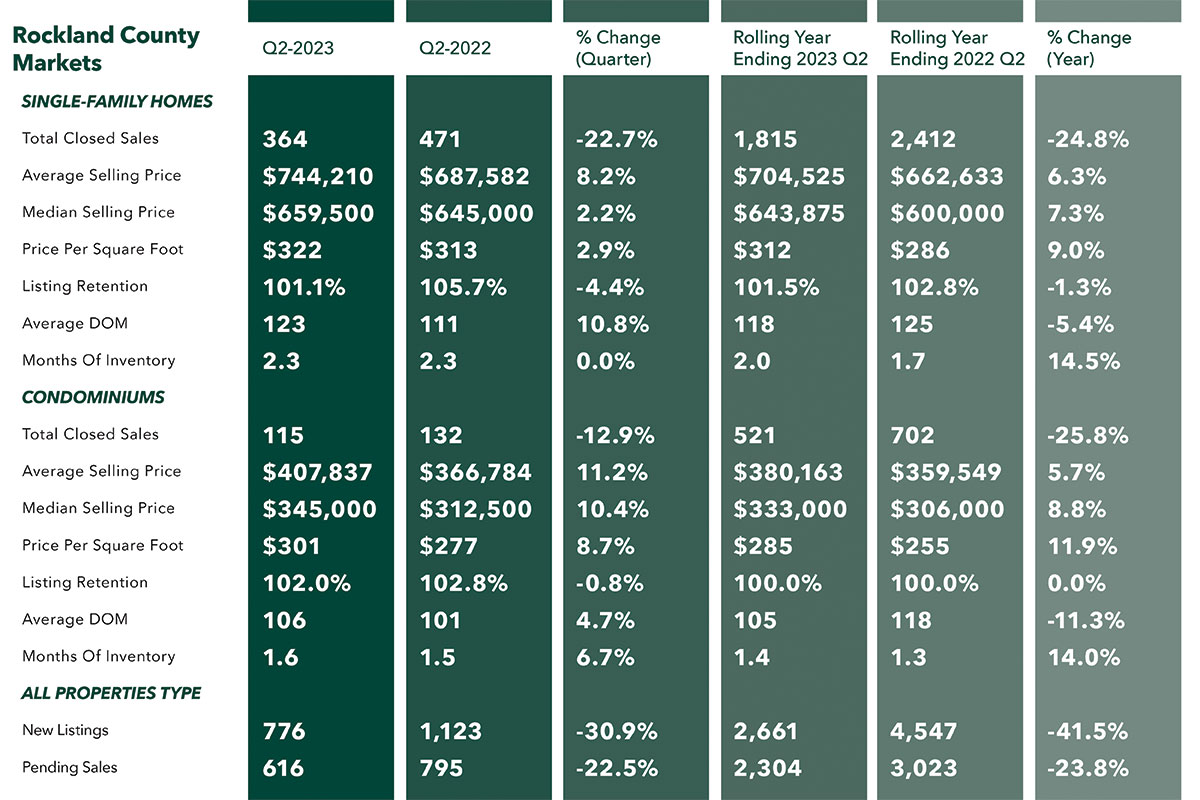
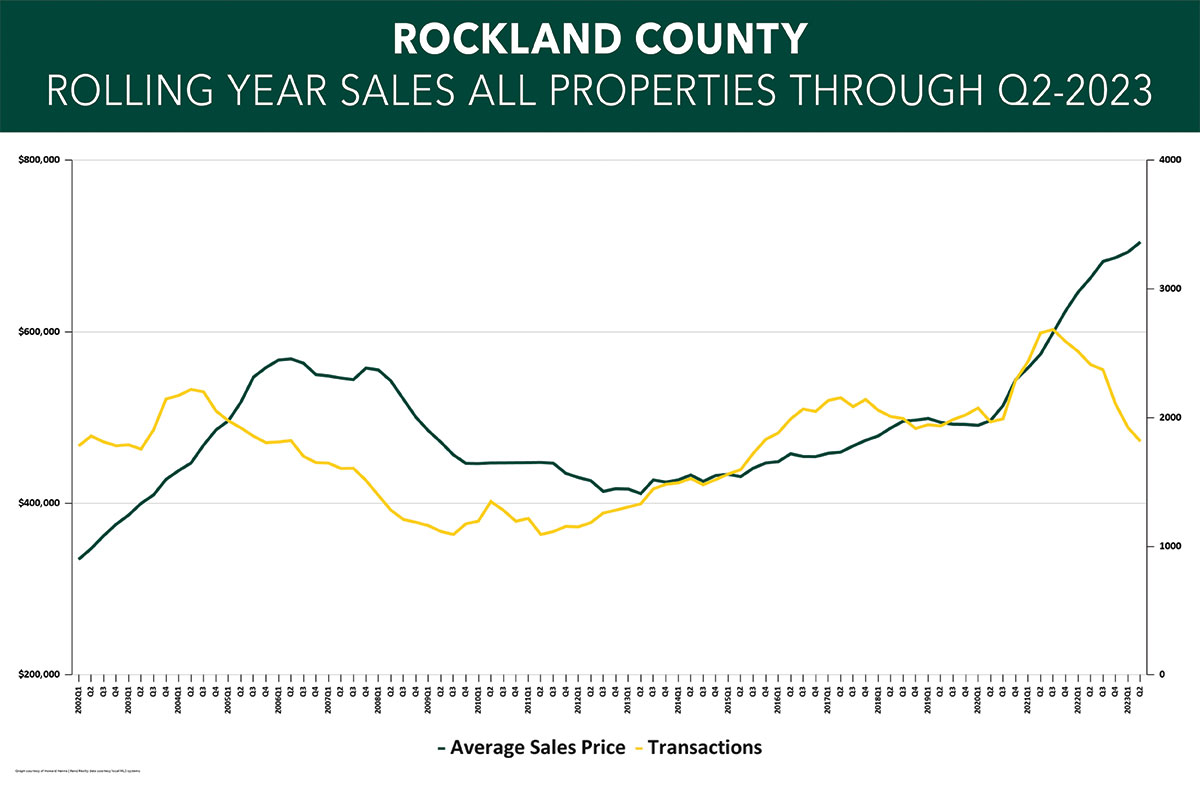
Sales in the Rockland County housing market fell sharply again in the second quarter, even while prices continued to hit all-time highs.
Rockland sales were down considerably in the second quarter, falling 22.7% for single-family homes and 12.9% for condos. Moreover, pending sales, which are a leading indicator of future closings, were also down, falling 22.5% for all property types combined. But even with sales continuing to fall, prices went up again, with single-family home prices up 8.2% on average and 2.2% at the median for the quarter, and now up 6.3% on average and 7.3% at the median for the year. Similarly, condo prices were way up, rising 11.2% on average and 10.4% at the median for the quarter, and up 5.7% on average and 8.8% at the median for the year.
The major reason prices are still increasing is the lack of housing supply. Rockland is down to 2.3 months of available inventory for single-family homes and 1.6 months for condos. This is well below the “balanced market” level of six months and explains in part while sales are down (we don’t have enough to sell) and prices are up (even with rates up, too many buyers are chasing too few homes).
Going forward, we believe that sales will start to level off compared to last year’s results, and that prices will likely start to stabilize near their current levels.


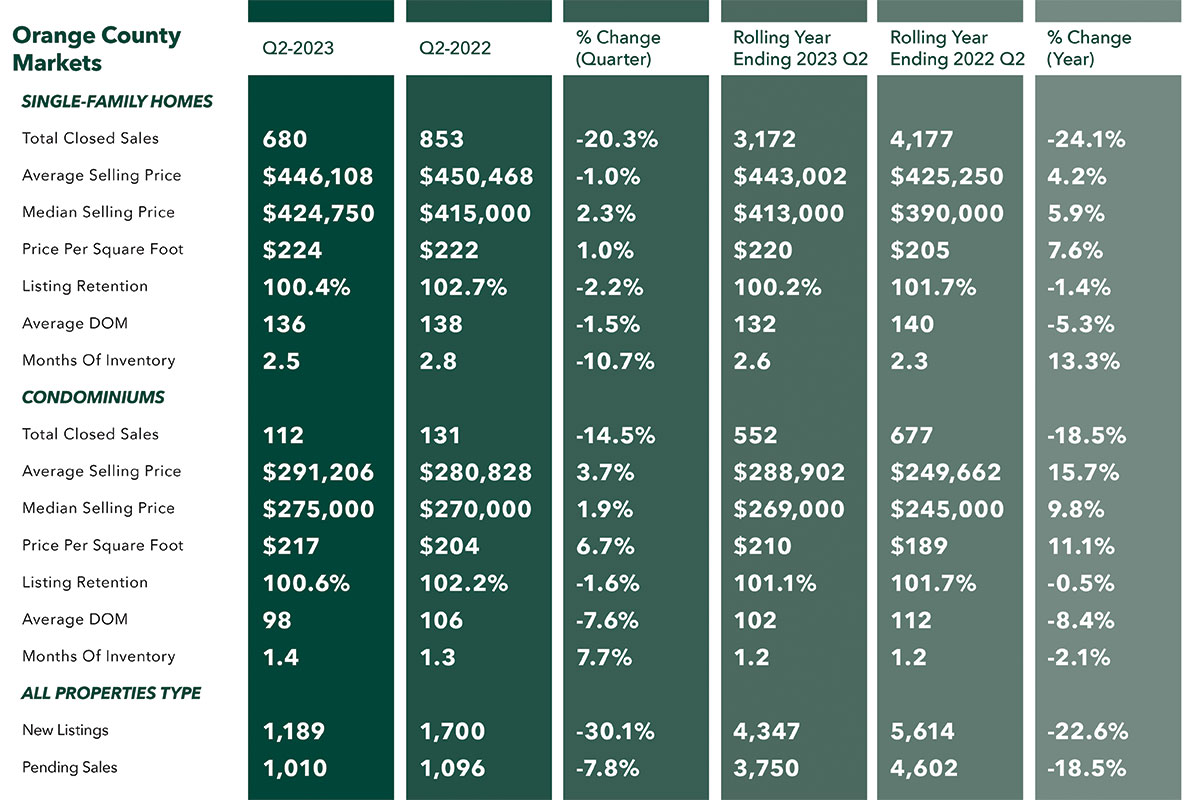
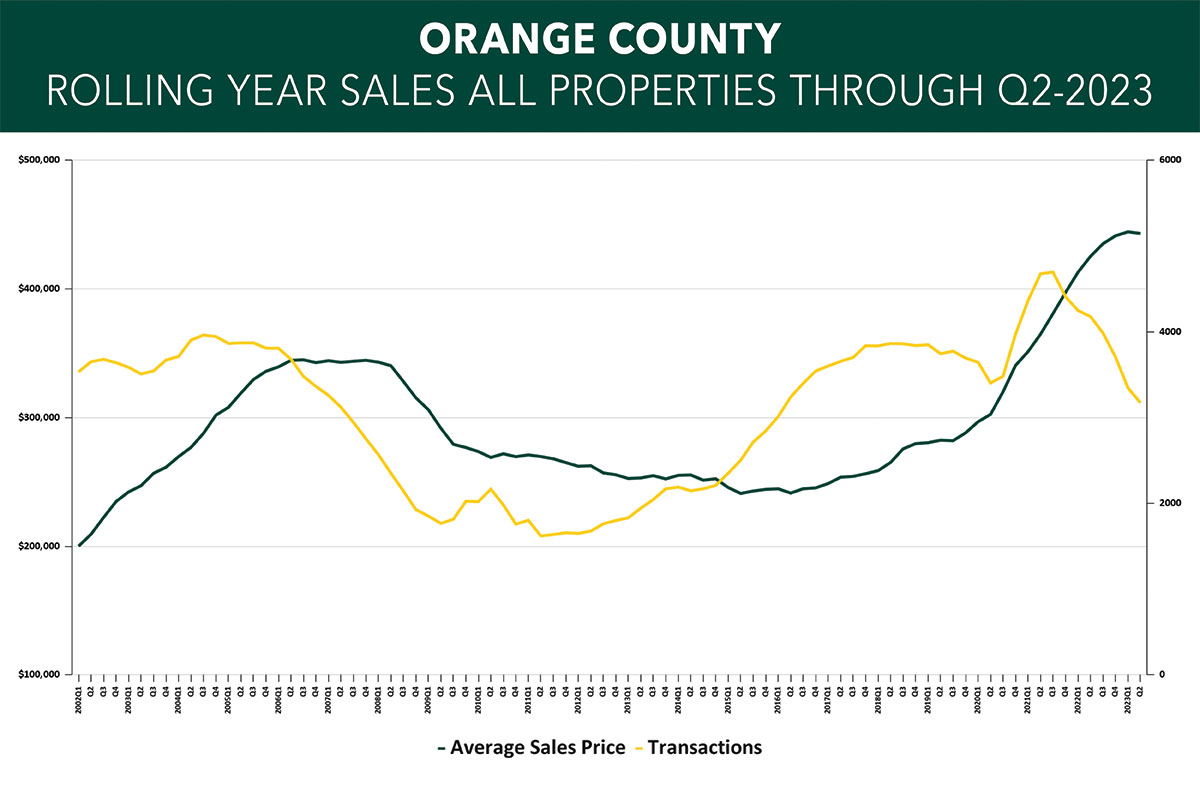
Sales in the Orange County housing market fell again in the second quarter of 2023, with the first signs that prices might be coming off their historic highs.
Orange sales were down across the board, with transactions falling 20.3% for single-family homes and 14.5% for condos compared to last year’s second quarter. Moreover, the weak quarter closed out a rolling year where sales fell 24.1% for single-family homes and 18.5% for condos. And pending sales, which are a leading indicator of future closings, were also down, falling 7.8% for all property types combined.
Even with sales down, prices were mostly up. Orange single-family average prices came down a slim 1.0% compared to last year’s second quarter, which is the first sign that the slowing market might be putting downward pressure on prices. But single-family median prices were up 2.3%, and condo prices were up 3.7% on average and 1.9% at the median, so the overall trend is still relatively positive.
Why are prices still going up? Because inventory is still way down. The real challenge in Orange, like most of the region, is the lack of supply, with months of inventory down to 2.5 months for single-family homes and 1.4 months for condos. This is well below the “balanced market” level of 6.0 months and explains why we’re seeing sales go down and prices go up – we have too many buyers chasing too few homes for sale.
Going forward, we believe that sales will start to level off compared to last year’s results, but that prices have probably reached their high-water mark for the year.


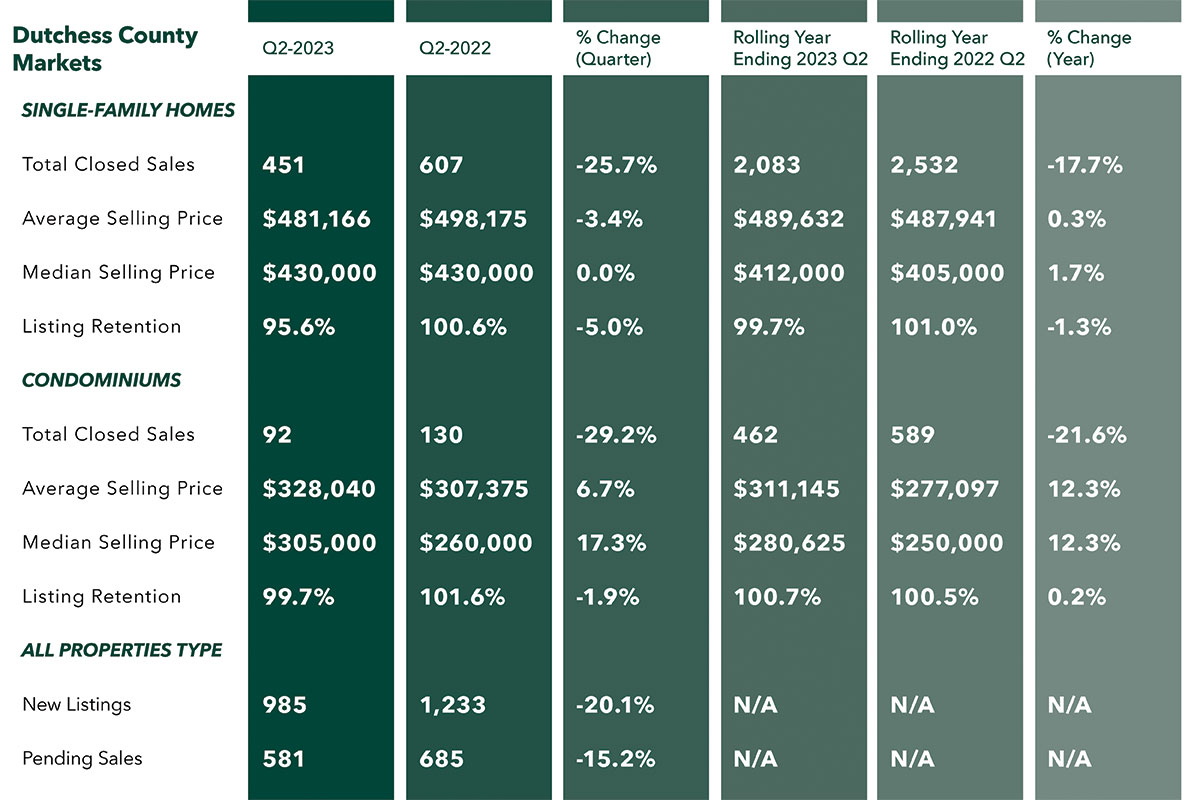
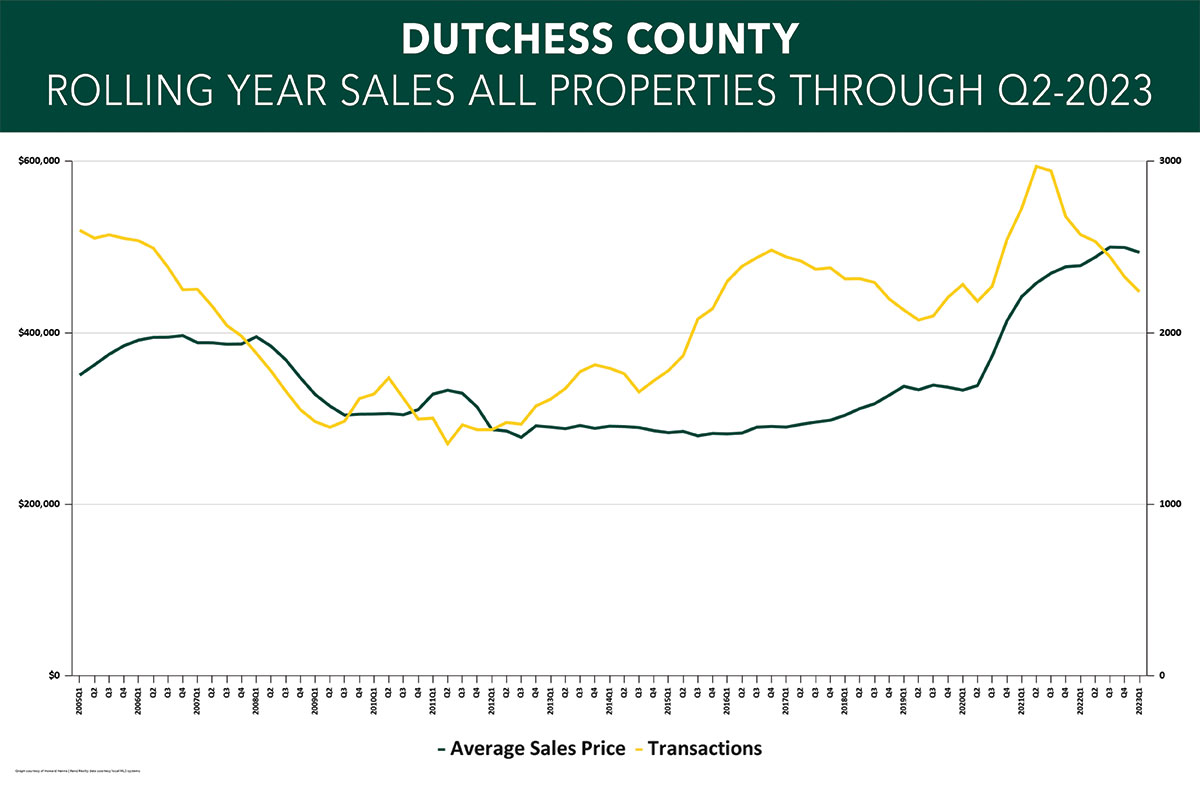
Sales in Dutchess County continued to fall in the second quarter of 2023, with mixed results in pricing.
Sales were down across the board, with closed sales falling 25.7% for single-family homes and 29.2% for condos compared to last year’s second quarter. Similarly, they fell 17.7% for single-family and 21.6% for condos compared to the last rolling year. We should note that we are measuring off a quarter and rolling year that were at the very tail end of a historic housing bull market, so part of the decline is because we’re comparing the results to an all-time high baseline. Accordingly, we are likely to see sales start to stabilize compared to last year’s numbers, simply because we will have a lower baseline to clear.
The decline in sales had some impact on pricing. Single-family home average sales prices were down 3.4% for the quarter, even while they were flat for the year. But condo prices were up 6.7% for the quarter and 12.3% for the year.
Going forward, we believe that sales will start to level off compared to last year’s lower baseline, but that prices will continue to see some downward pressure through the rest of the year.


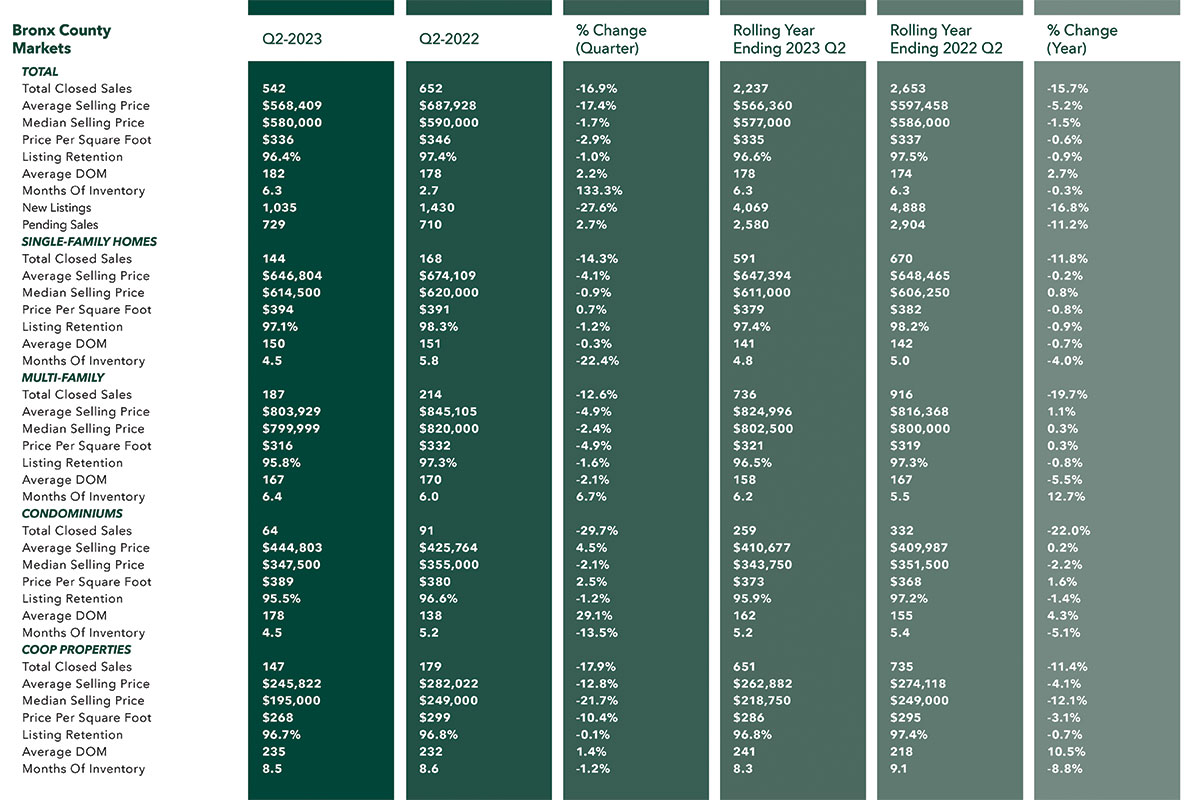
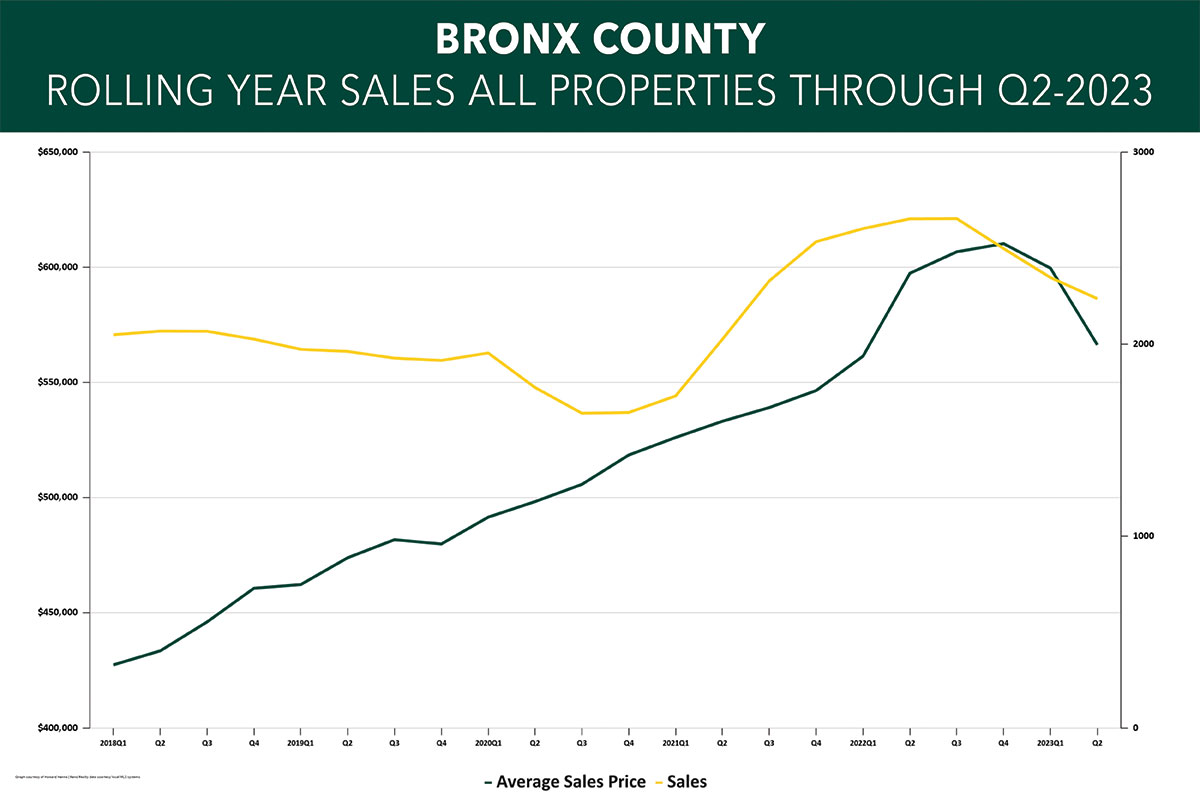
The Bronx housing market continued to slow in the second quarter of 2023, with declines in both sales and prices.
Closed transactions fell across the board, dropping 16.9% overall and down for all property types compared to last year’s second quarter. And for the rolling year, overall sales were down 15.7% and down for all property types. Clearly, the softening of the Manhattan market has spread to the adjacent markets in New York City. That said, we should note that we are measuring off a quarter and rolling year that were at the very tail end of a historic housing bull market, so part of the quarterly decline is because we’re comparing the results to an all-time high baseline. Accordingly, we are likely to see sales start to stabilize compared to last year’s numbers, simply because we will have a lower baseline to clear.
This decline in sales is starting to have an impact on pricing. Average prices compared to last year’s second quarter were up 4.5% for condos, but were down for the other property types: falling 4.1% for single-family homes, 4.9% multi-families, and 12.8% for coops. The market throughout New York City is sluggish right now, and the Bronx is no exception.
Going forward, we expect sales to flatten out compared to last year’s levels through the rest of the year, but we believe that prices will continue to come down off their all-time highs.


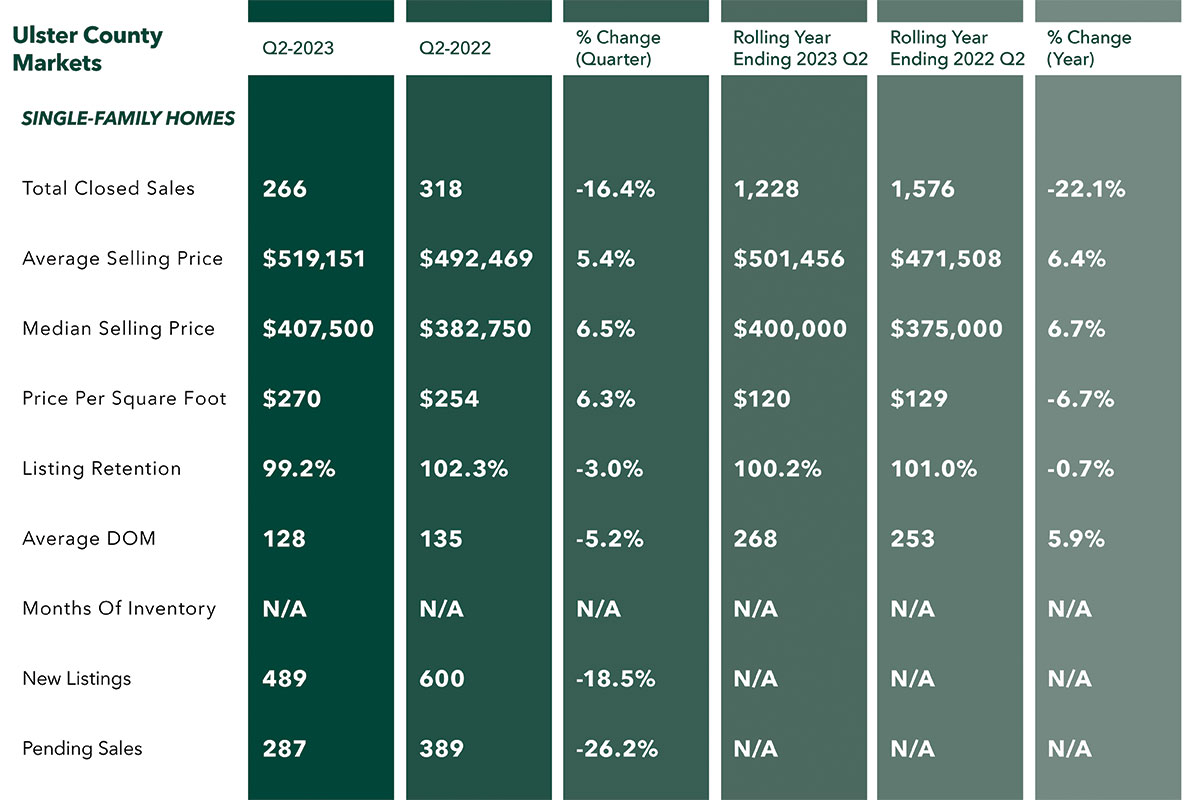
Sales in the Ulster County housing market fell again in the second quarter of 2023, even while prices continued to hit all-time highs.
Ulster County sales activity was down again, with closings falling 16.4% and pending sales falling 26.2% compared to last year’s second quarter. And for the rolling year, sales are now down 22.1%. We should note that we are comparing against a quarter and rolling year that were at the very tail end of a historic housing bull market, so part of the decline is because we’re measuring off an all-time high baseline. Accordingly, we are likely to see sales start to stabilize compared to last year’s numbers, simply because we will have a lower baseline to clear. But even with sales falling, prices continued to rise, with second-quarter prices up 5.4% on average and 6.5% at the median. And for the rolling year, the average price was up a robust 6.4% on average and 6.7% at the median.
Prices are still going up because of the severe lack of homes for sale in Ulster. At the end of the quarter, Ulster had only 2.7 months of inventory available at the end of the quarter, well below the six-month level that marks a “balanced market.” That’s why we are seeing sales go down while prices go up – we have too many buyers chasing too few homes for sale. And we don’t see any relief in sight, with new listings down 18.5% compared to last year’s second quarter.
Going forward, we do believe we will see sales stabilize at last year’s levels, but that we might be seeing prices at a high-water mark for the year.


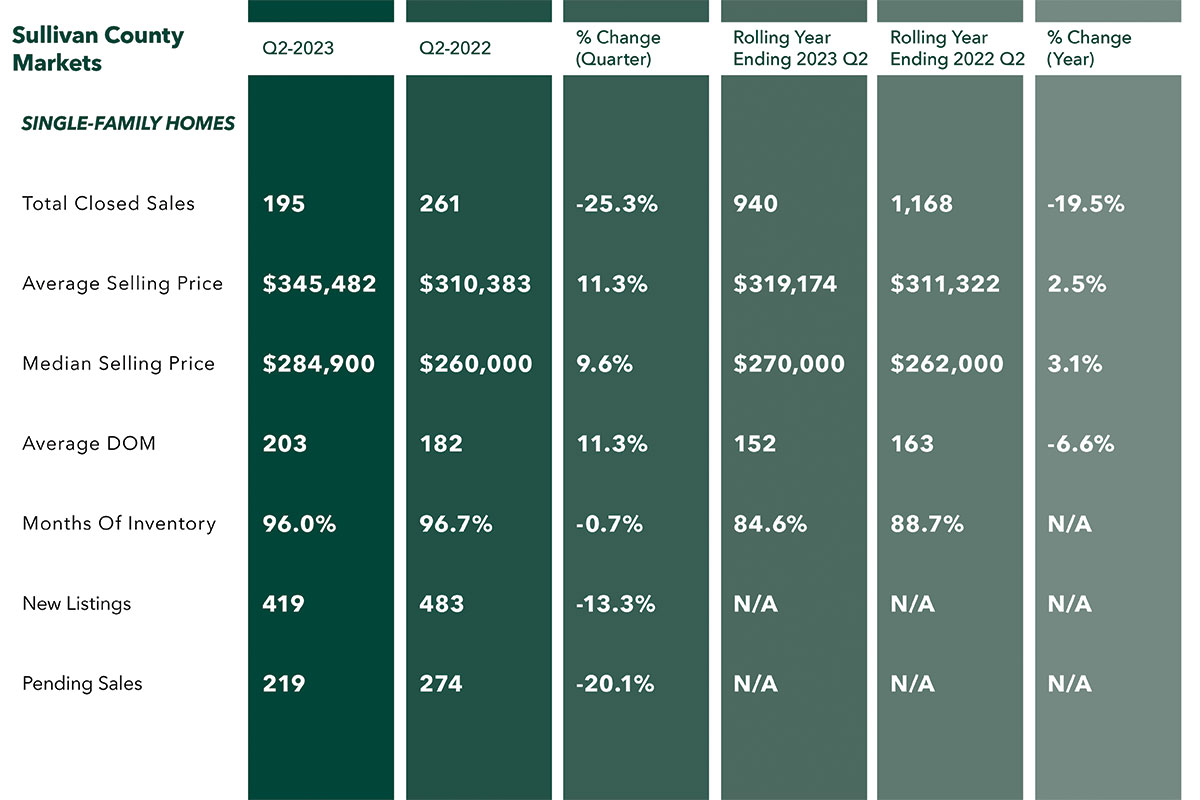
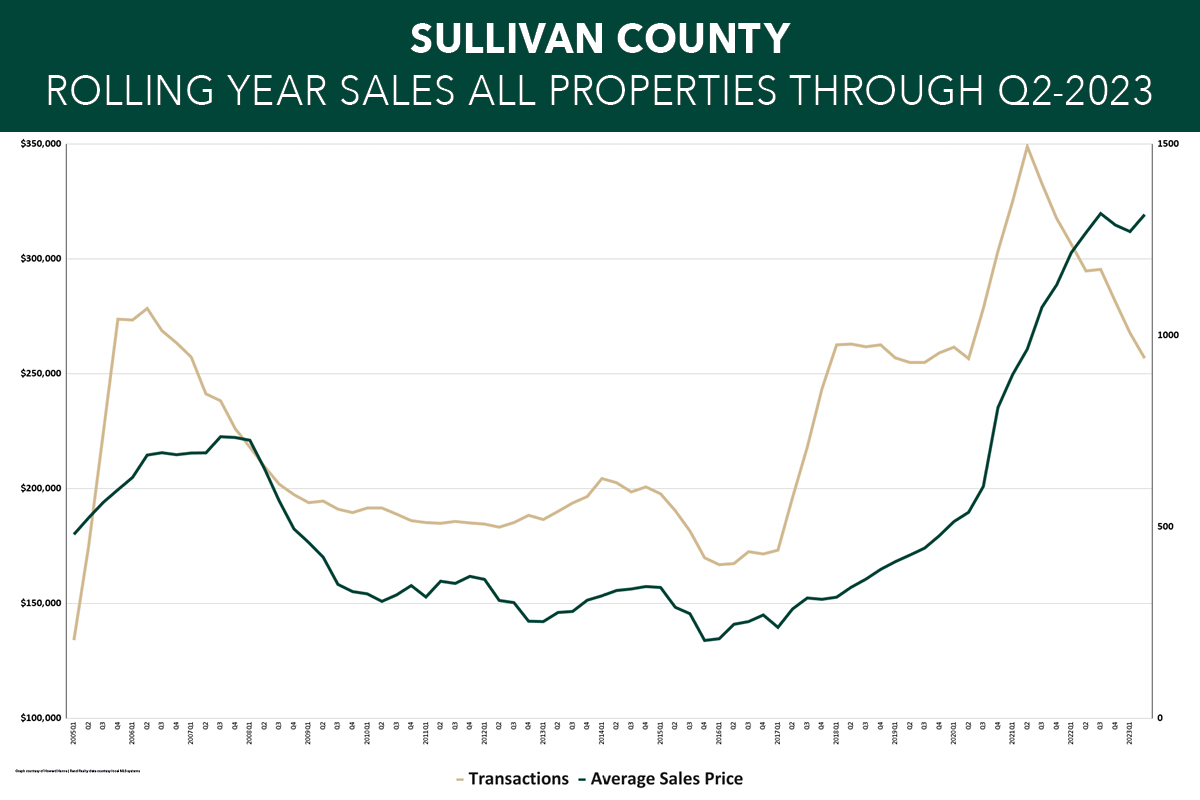
The Sullivan County housing market had mixed results in the second quarter of 2023, with sales down but prices way up.
Sullivan closings were down 25.3% for the second quarter and 19.5% for the rolling year, continuing a trend that we’ve seen for the past year or so. And pending sales, which are a leading indicator to future closings, were down 20.1% compared to last year’s second quarter. To be sure, we are measuring off a quarter that was at the very tail end of a historic housing bull market, and we do expect sales will stabilize at last year’s levels through the rest of the year.
Even with sales down, though, prices rebounded from a weak first quarter, with average prices up 11.3% and median prices up 9.6% for the quarter. For the year, average prices were up 2.5% and median prices were up 3.1%, so Sullivan is still experiencing price appreciation even while sales fall quarter after quarter.
Why are sales going down while prices go up? It’s all about a lack of inventory. Sullivan still does not have enough homes for sale, with listings down 13.3% from last year and inventory levels at 4.9 months of inventory, which is well below the 6.0 level that signals a “balanced” market. These low levels of inventory are holding back sales even while they drive up prices.
Going forward, we believe that sales will start to level off compared to last year’s results, and that prices will stabilize near their current levels through the rest of the year.


