
 Facebook
 X
X
 Pinterest
 Copy Link
Homes in Northern New Jersey Are Cheaper Than They’ve Been in a Generation!
Right now is a really great time to be buying a home in Northern New Jersey
Man, do I hate saying that. As I’ve explained before, I hate the phrase “great time to buy,” for a couple of reasons.
First, people have different needs, and a market that’s great for one person might be terrible for another person.
Second, while markets tend to move together, we do see micro-markets (i.e., towns and villages) that defy larger trends. So while it might be a great time to buy in Village A, it might be not so great in Town B.
Third, and most importantly, though, “it’s a great time to buy!” just seems like a hack thing to say, the kind of thing that TERRIBLE real estate agents have said for generations to get unsuspecting and gullible people to buy an overpriced home. And I think that most people get suspicious when real estate agents talk like that.
So I understand if you’re skeptical. And that’s why I don’t want to just TELL you it’s a great time to buy, I want to SHOW you why it’s a great time to buy.
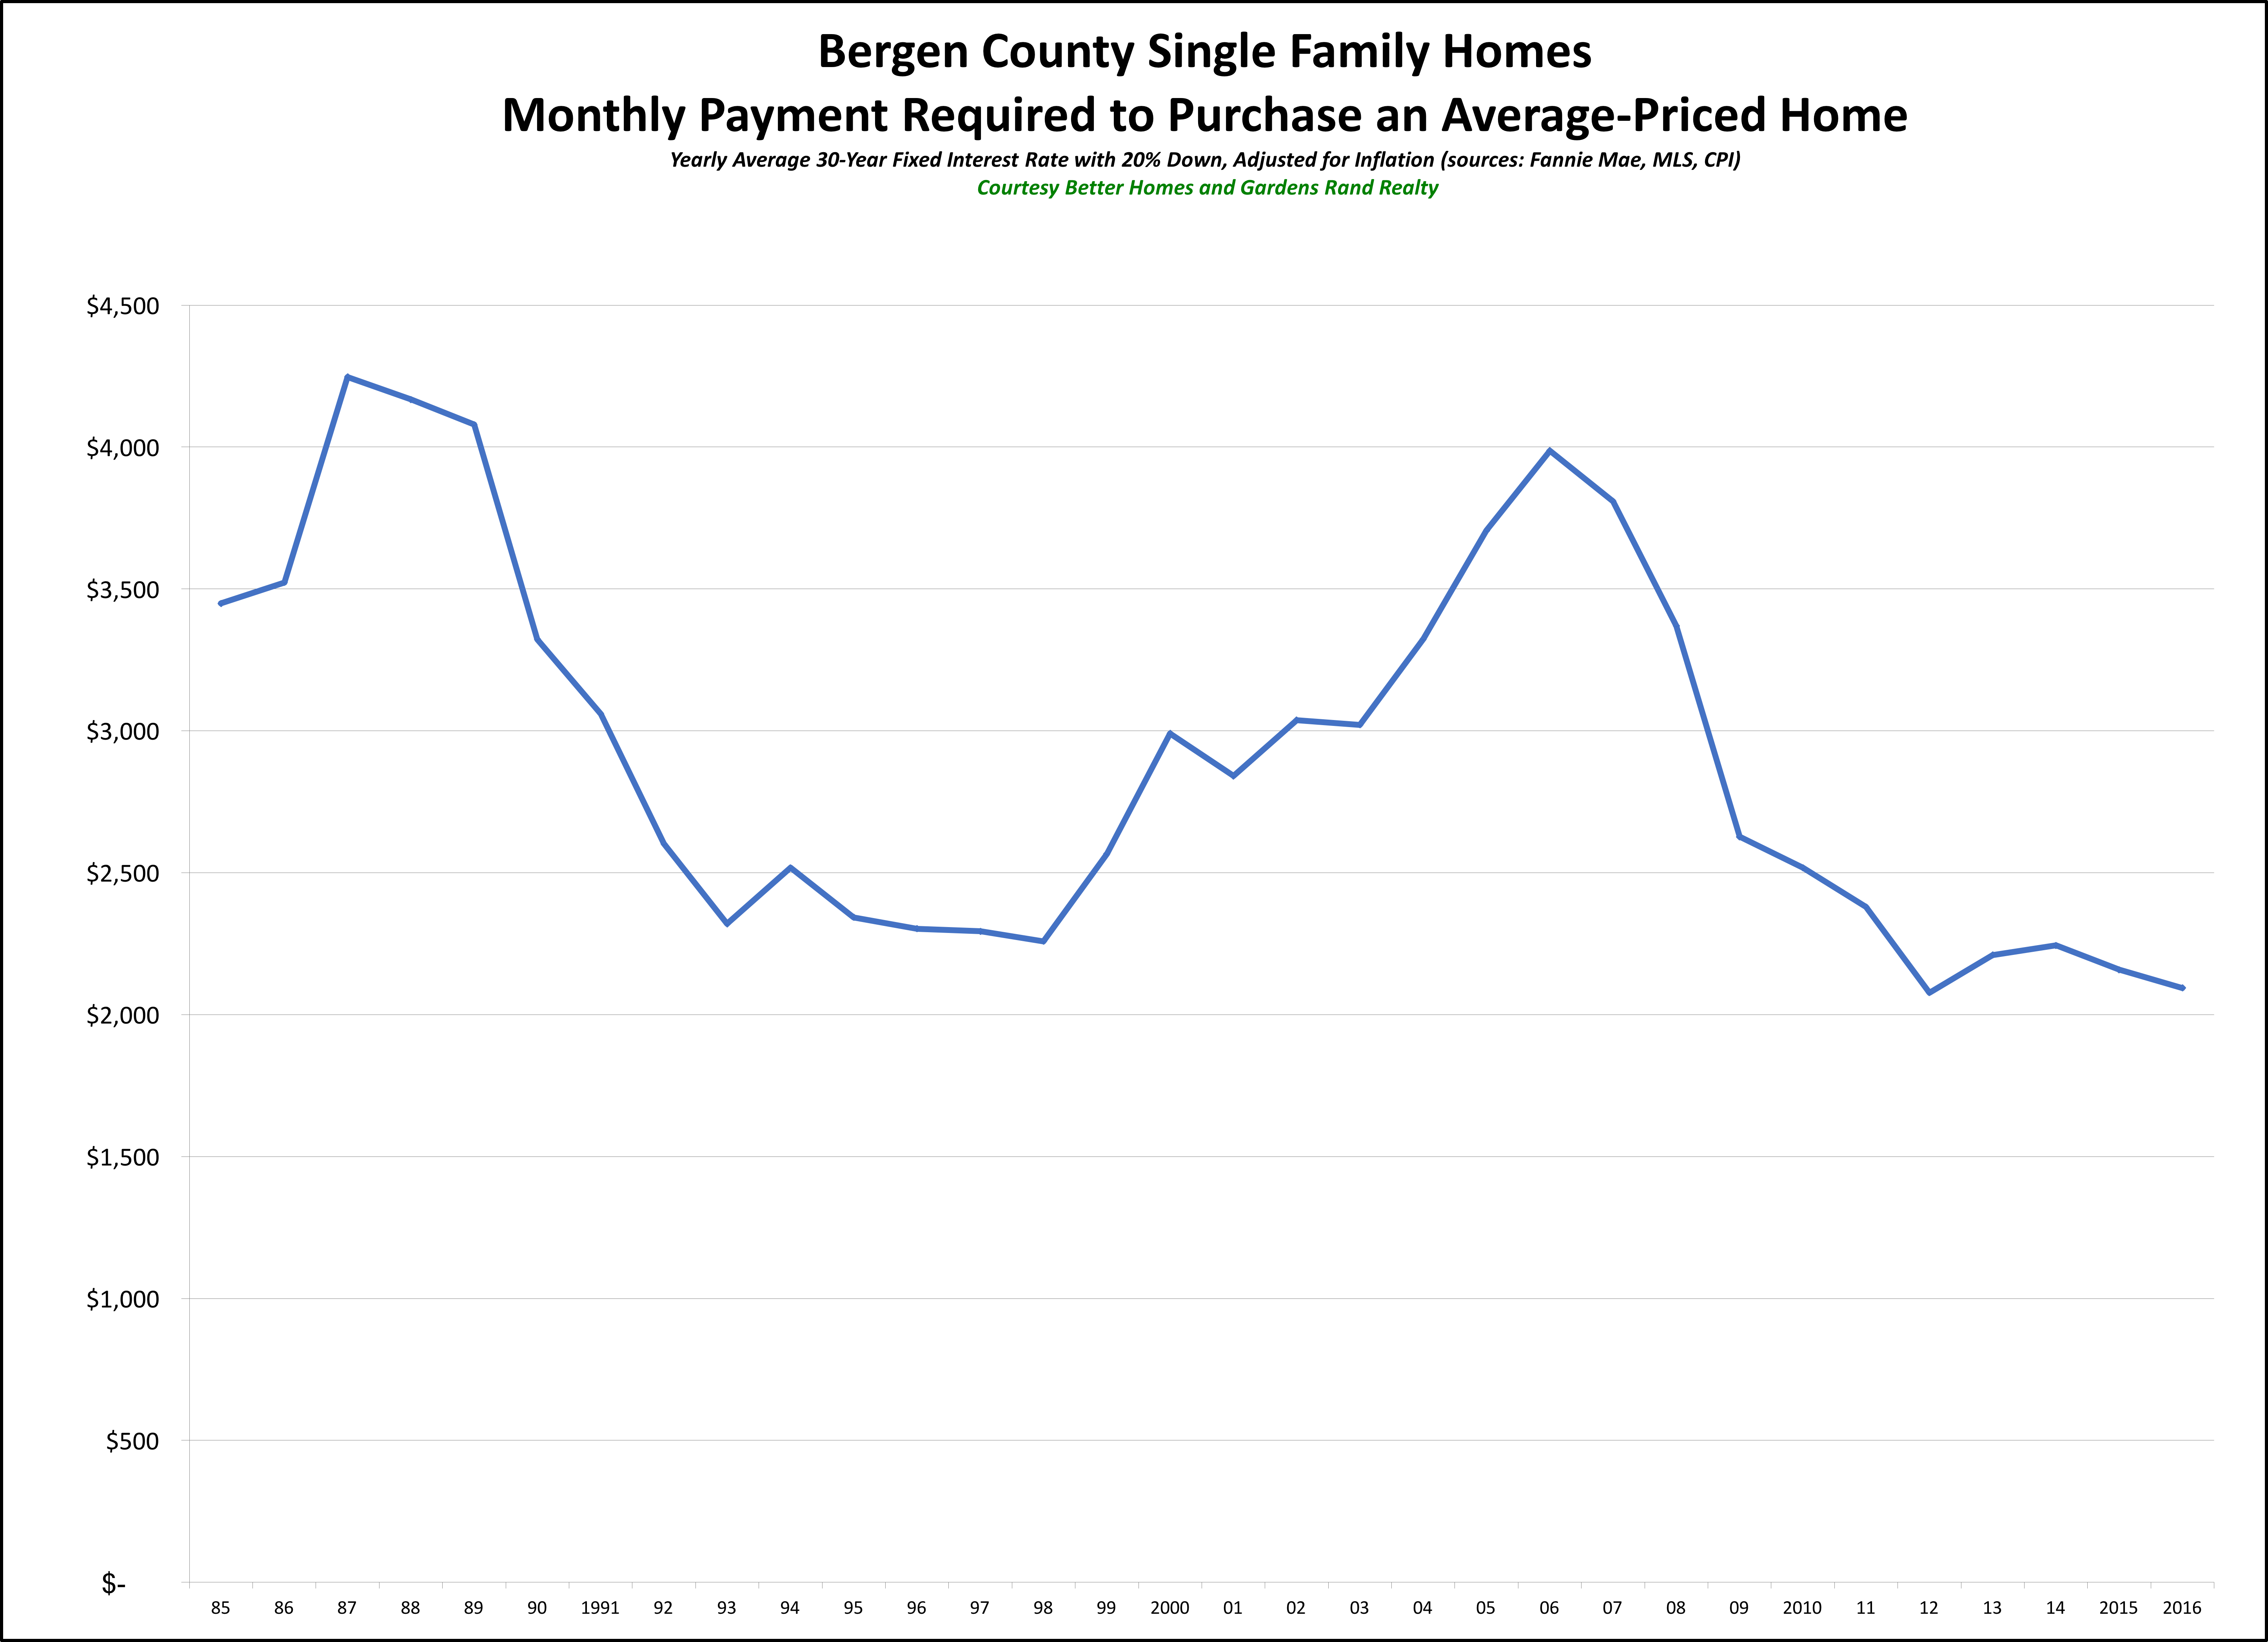
Specifically, I want to make this specific point: the monthly payment you need to buy an inflation-adjusted average priced home in Northern New Jersey is as low as its been in a generation.
Think about what I’m saying for a second. I’m NOT saying that homes are cheaper than they’ve ever been. That’s not true. Depending on the year, homes have appreciated, and if you go back more than 15 years, they’ve appreciated pretty dramatically. I’m just saying that the MONTHLY PAYMENT you need to make to buy the AVERAGE PRICED HOME is lower right now than it’s been in a generation — if you control for the effects of inflation.
Take a look at these graphs for Bergen and Passaic Counties, and you’ll see what I mean:

On these graphs, as we’ve done before, we’ve plotted the monthly payment that a purchaser in the county would have to make to purchase the average-priced home at various points over the years. After all, affordability is not just a matter of the sales price – it’s a matter of the monthly payment you’re going to have to make, which is partly a function of the prevailing interest rate. And then to measure the change in the monthly payment over time, we factored in the effects of inflation.
So we took the following data points:
•The average price of a single family home up to the end of 2016 – from the local MLS data.
•The average interest rate for a 30-year fixed-rate mortgage for every calendar year up to 2016 – from Freddie Mac.
•The prevailing inflation rate for every calendar year up to 2016– from the US Department of Labor.
You can see the results on the graph. The monthly payment you have to make to purchase the average-priced home in Bergen or Passaic is just about as low as it’s been in years. We saw the slightest uptick from 2012-2014, partially because of a slight increase in pricing and a slow inflating of interest rates. But the payment came down again over the past two years, with rates falling and prices stalling.
Generally, though, we’re talking about a monthly payment that is as low as anytime in the past 30 years – and as low as it was in the mid-1990s, during a crippling buyer’s market. We don’t have data going back in Passaic as far as we do in Bergen, but there’s no reason to think that the markets behaved differently during the 1980s.
So why are monthly payments lower than they’ve been in a generation? A couple of reasons:
1) Prices. Part of it is that we have not seen prices go up in any measurable way in almost 10 years. Home prices peaked in 2006-08, lost about 25-30% of value from 2008-2010, and have bounced around a little since then. But they’re still around 2004 levels — without controlling for inflation.
2) Inflation. Ah, yes, inflation — the value of money goes down a little bit each year as inflation takes a bite. Now, inflation rates have been pretty low over the past 15 years from historical standards, but that little bit each year does add up.
3) Rates. But the biggest reason we’re seeing monthly payments lower than they’ve been in a generation is that rates are still at historic lows. After all, about ten years ago, the average interest rate was about 6%. For the past few years, it’s been below 4%. That’s a huge difference in your monthly payment.
Again, I HATE it when real estate professionals say that “this is a great time to buy,” because at many times in our history that has been bad advice.
But if you measure a “great time to buy” by looking at the monthly payment you’ll have to make to buy a home, then we’re talking about as good a time to buy as any in the past decades. Prices have been flat for almost 10 years, and they’re down significantly if you factor in the effects of inflation. And interest rates are still as low as we’ve ever seen them. Unless we see some major shock to the economy, I think we’re looking at a near-decade of reasonable price appreciation coupled with increasing interest rates – both of which are going to drive that monthly payment up over the next few years.
So I’m not going to tell you what to do. That’s not my job. But if you’ve been thinking about buying a home, I think these graphs speak for themselves.
Joe Rand is the Chief Creative Officer of Better Homes and Gardens Real Estate | Rand Realty, and compiles and writes the Rand Quarterly Market Report.
To learn more about Better Homes and Gardens Real Estate Rand Realty, visit their website and Facebook page, and make sure to “Like” their page. You can also follow them on Twitter.
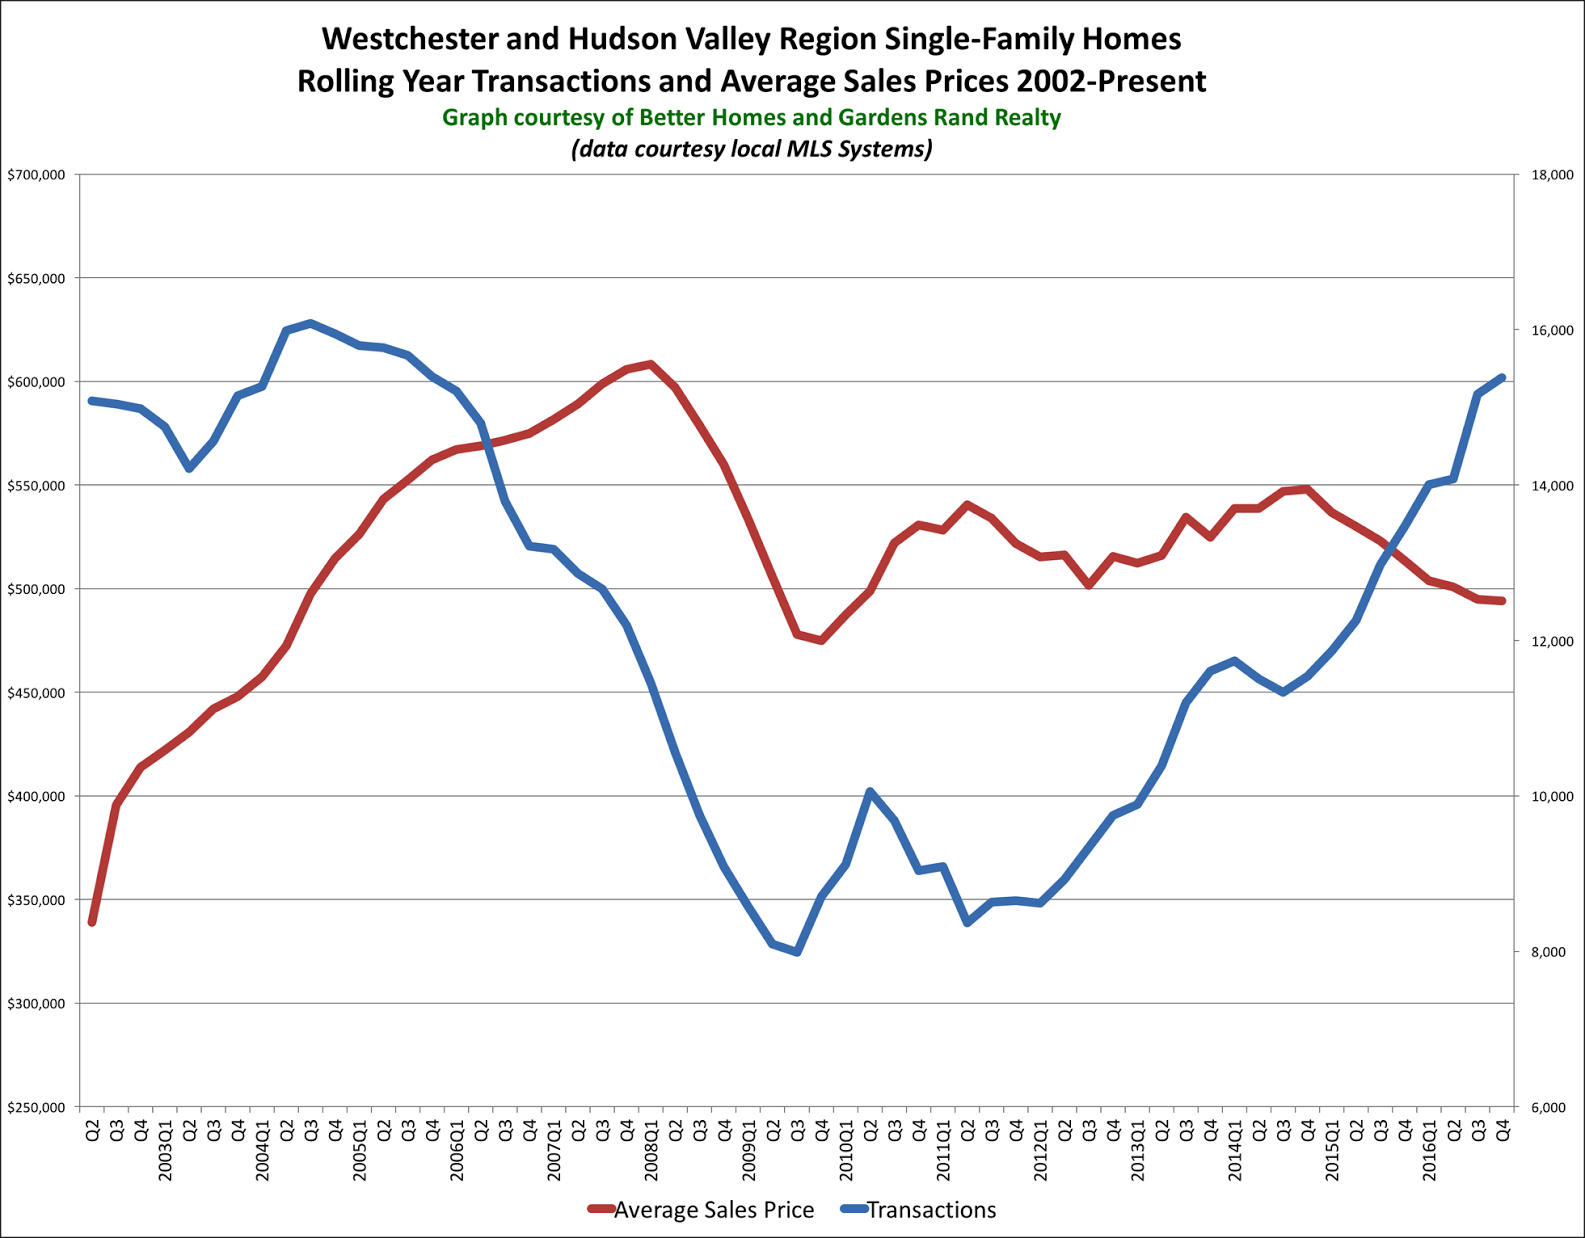
Better Homes and Gardens Rand Realty Quarterly Market Report For 2016Q4 Overall: Westchester and Hudson Valley
 The story of the housing market in Westchester and the Hudson Valley at the end of 2016 was all about inventory. The number of homes on the market continues to decline, which is already negatively impacting the rate of sales growth, but is likely to positively impact price appreciation in 2017.
Inventory throughout the region continues to fall. As we have explained before in the Rand Report, we measure the “months of inventory” by looking at the number of available homes on the market, and then calculating how long it would take to sell them all at the current rate of absorption. In the industry, we consider anything below six months of inventory to be a signal of a tightening market that will tend to drive prices up. So it’s notable that region inventory at the end of 2016 was down to 6.2 months. But the decline was more striking if you look at the individual counties, with inventory down to 3.8 months in Westchester, 5.0 in Putnam, 4.9 in Rockland, and 6.4 in Orange. Indeed, if you take Dutchess (which is still in the double digits) out of the calculation, the overall regional average is down to 4.2 months of inventory. That’s extraordinarily low, especially when you consider that regional inventory was over 10 months just two years ago.
The lack of inventory is starting to have an impact on sales. Sales are still relatively strong, but the pace of growth is slowing. Single-family transactions were up for the region, rising 6% from the fourth quarter of last year, which now marks nine straight quarters of year-on-year sales growth. And regional sales were up sharply for the calendar year, rising over 14% from 2015 and crossing over the 15,000 transaction mark for the first time since 2005. Indeed, yearly sales are now up 78% from the market bottom in 2011. But we see some troubling signs. For example, that 6% rise in sales from last year is the smallest year-on-year sales increase in eight quarters. Moreover, although regional sales were up, individual counties were flat or down: Westchester was up only 1.4%, and Rockland was down 3.6%. Essentially, the market needs more fuel for the fire — without more listings on the market, we are likely to see sales flatten or even decline in 2017.
Prices continue to struggle throughout the region. The regional average sales price was down just a tick for the quarter, but fell almost 4% for the calendar year. How can that be? We are seeing sustained buyer demand coupled with declining inventory over the past few years, and sales totals that approach the tail end of the last seller’s market. Basic economics tells us that increasing demand and falling supply should drive prices up. And, well, they will. It’s just a matter of time. At some point soon, these high levels of buyer demand, along with the low levels of inventory, will start creating the kind of multiple offer situations and bidding wars that will drive prices up. In turn, as prices go up, homeowners watching and waiting from the sidelines will be tempted into the market, which will moderate the potential surge in price appreciation. In other words, we’re about the witness “Economics 101” in action.
Going forward, we remain confident that the market conditions are ripe for meaningful price appreciation in 2017. Demand is strong, bolstered by near-historically-low interest rates, prices that are still near 2004-05 levels (without controlling for inflation), and a generally strong economy. And supply is tight, at least until some price appreciation brings more sellers into the market. So in the short term, we might see some declines in home sales off the highs set in 2016. But over time, as high-demand-and-short-supply starts driving prices up, inventory will come back. And we will eventually see the return of sales growth, this time coupled with meaningful price appreciation.
To learn more about Better Homes and Gardens Real Estate® – Rand Realty, visit their website and Facebook page, and make sure to “Like” their page. You can also follow them on Twitter.
Real Estate Market Report: Third Quarter 2016 – Sussex County, New Jersey
 The Sussex County housing market surged again in the third quarter of 2016, with sales up sharply and some modest appreciation in pricing.
Sales. Sussex sales were up again in the third quarter, rising 9% from last year and finishing the year up over 23%. This continued a trend that we’ve been watching for the past four years, with year‑on‑year sales up almost every quarter since 2012. Indeed, Essex closings are now reaching levels that we have not seen since the tail end of the last seller’s market, with sales now up about 80% from their 2011 bottom. So the market is in much stronger shape than it has been at any time since the 2008‑09 market correction.
Prices. These sustained increases in buyer demand are finally having their expected impact on pricing. Average and median sales prices were both up in the third quarter, rising 0.3% on average and over 5% at the median. For the year, prices were down almost 3% on average and almost 1% at the median, but the trend was welcome. It takes time for increases in demand to drive pricing changes, so we believe this trend will continue if buyer demand remains at its current levels.
Inventory. The “months of inventory” indicator measures how long it would take to sell out the existing inventory of homes at the current rate of home sales. In the industry, we generally consider anything below six months as a signal for a seller’s market, where tight inventory leads to multiple offer situations, bidding wars, and ultimately appreciating prices. Sussex inventory remains well above that threshold, at 12 months, but that’s down almost 32% from last year.
Negotiability. The negotiability indicators – the amount of time sold homes were on the market, and the rate at which sellers were able to retain their full asking price – both supported the idea that sellers were gaining negotiating leverage with buyers. The days‑on‑market fell by three days, indicating that homes were selling more quickly. And the listing retention rate rose to over 95%, signaling that sellers were finding it a little easier to get buyers to agree to their list prices.
Going forward, we believe that Sussex is poised for better things. Buyer demand has been strong for almost four years now, which is bound to eventually have a positive effect on prices. With an improving economy, homes priced at attractive levels, and near‑historically low interest rates, we expect buyer demand to eventually drive modest but meaningful price appreciation in 2017.
To learn more about Better Homes and Gardens Rand Realty, visit their website and Facebook page, and make sure to “Like” their page. You can also follow them on Twitter.
Real Estate Market Report: Third Quarter 2016 – Essex County, New Jersey
 The Essex County housing market was a mass of contradictions in the third quarter of 2016, with sales down but prices up.
Sales. Essex activity continued to disappoint in the third quarter, with transactions down almost 3% from last year. This marked the first quarter of year‑on‑year sales declines in almost two years, breaking a six‑quarter streak of sales growth. After a robust beginning to the year, Essex is now significantly underperforming its neighboring counties, with the rolling year sales up only about 3%, well below what we’re seeing elsewhere in the region.
Prices. Even with the slackening of activity, prices showed some signs of life. The average price was up about 4%, with the median up just a tick. This was welcome news to Essex homeowners, since we had seen prices go down over the past two quarters. The overall picture, though, is not promising, with rolling year pricing down over 1% on average and almost 5% at the median.
Inventory. The “months of inventory” indicator measures how long it would take to sell out the existing inventory of homes at the current rate of home sales. In the industry, we generally consider anything below six months as a signal for a seller’s market, where tight inventory leads to multiple offer situations, bidding wars, and ultimately appreciating prices. Essex continues to see declining inventory, falling almost 18% in the quarter down to under seven months. That’s a pretty tight market, so we would normally expect to see some upward pressure on pricing.
Negotiability. The negotiability indicators – the amount of time sold homes were on the market, and the rate at which sellers were able to retain their full asking price – suggested the sellers might be gaining just a little bit of negotiating leverage. The days‑on‑market fell just a day, but the listing retention rate was up to almost 100%. Those are both positive signals of potential future appreciation.
Going forward, we expect that Essex County’s sales activity will eventually have a meaningful impact on pricing. With homes still at historically affordable prices, interest rates low, and a generally improving economy, we believe that buyer demand will strengthen and drive modest but meaningful price appreciation in 2017.
To learn more about Better Homes and Gardens Rand Realty, visit their website and Facebook page, and make sure to “Like” their page. You can also follow them on Twitter.
Real Estate Market Report: Third Quarter 2016 – Morris County, New Jersey
 The Morris County housing market softened in the third quarter of 2016, with sales up modestly and prices mixed.
Sales. Morris County sales were up only slightly, rising about 4% from the third quarter of last year. Even that tepid increase, though, was enough to continue a two‑year streak in which year‑on‑year sales have gone up for eight straight quarters. The long‑term trend is also relatively encouraging, with sales up 9% for the rolling year.
Prices. This sustained increase in sales, though, has not yet had its expected impact on pricing. Prices were mostly mixed, with the average up a tick and the median down slightly. For the year, the results were a little more discouraging, with the average falling over 2% and the median down over 1%. And after some meaningful price appreciation in 2015, we have now seen prices down for most of this year. This was a little surprising, given that we’ve seen sales activity up for almost two years. Normally, rising sales activity should drive appreciating prices.
Inventory. The good news for Morris homeowners and sellers is that inventory continues to tighten. In the industry, we generally consider anything below six months of inventory as a signal for a “tight” market, leading to multiple offer situations, bidding wars, and ultimately appreciating prices. By that measure, we are certainly moving toward a seller’s market, with Morris now down to 7.3 months of inventory, falling almost 22% from last year.
Negotiability. The negotiability indicators showed only modest signs that sellers might be gaining leverage with buyers. The days‑on‑market indicator was relatively flat, falling by five days. And the listing retention rate was up just a tick, indicating that sellers might be having a bit more success getting buyers to meet their asking prices.
Going forward, we expect that Morris County’s sales activity will eventually have a meaningful impact on pricing. With homes still at historically affordable prices, interest rates low, and a generally improving economy, we believe that buyer demand will strengthen and eventually drive modest but meaningful price appreciation in 2017.
To learn more about Better Homes and Gardens Rand Realty, visit their website and Facebook page, and make sure to “Like” their page. You can also follow them on Twitter.
Real Estate Market Report: Third Quarter 2016 – Passaic County, New Jersey
 Sales in the Passaic County housing market continued to rise in the third quarter of 2016, but these sustained levels of buyer demand are not yet having their expected impact on pricing.
Sales. Passaic sales were up again in the third quarter, rising over 6% from last year and finishing the rolling year up over 10%. Indeed, we’ve now seen sustained increases in buyer demand for over five years, with quarterly sales up in 20 out of the last 22 quarters. As a result, Passaic closed almost 3,200 homes over the last rolling year, a level Passaic had not reached in over 10 years, since the last seller’s market.
Prices. Unfortunately, these sustained increases in buyer demand are not yet impacting pricing. Prices were down, with the average price falling slightly while the median price was down over 3%. We would normally expect sustained increases in buyer demand to drive meaningful price appreciation, but Passaic pricing has been stubbornly resistant over the past few years. It may just be a matter of time, but basic economic principles would indicate that increasing demand, coupled with declining inventory, should drive prices higher.
Inventory. We generally consider anything below six‑months of inventory as a signal for a seller’s market, where tight inventory leads to multiple offer situations, bidding wars, and ultimately appreciating prices. Passaic County is still working its way to that level, but inventory was down over 20% to 8.3 months, so it’s moving in that direction.
Negotiability. The negotiability indicators both showed that sellers are gaining leverage with buyers. The days‑on‑market were down just a tick for the quarter, signaling that homes were selling a little more quickly. And the listing retention rate was up, indicating that sellers were getting closer to their asking price. Together, they show that sellers are slowly gaining some bargaining power with buyers, which should eventually lead to modest price appreciation.
Going forward, we believe that Passaic’s fundamentals are sound, with homes priced at relatively attractive levels, rates near historic lows, and a stable economy. Accordingly, we expect buyer demand to stay strong through the end of the year, with the strong possibility of meaningful price appreciation in 2017.
To learn more about Better Homes and Gardens Rand Realty, visit their website and Facebook page, and make sure to “Like” their page. You can also follow them on Twitter.
Real Estate Market Report: Third Quarter 2016 – Bergen County, New Jersey
 The Bergen County housing market plateaued in the third quarter of 2016, with sales and prices flat over the summer after a spike in spring activity.
Sales. Bergen sales were flat in the third quarter, rising less than 1% after a pretty robust period over the past two years. Indeed, even with that minimal sales increase, Bergen has now seen eight straight quarters of year‑on‑year sales growth. That sustained period of increasing buyer demand resulted in a rolling year where sales were up 10%, with the 6,657 sales marking the highest twelve‑month total in over ten years — at the height of the last seller’s market.
Prices. Unfortunately, we are still not seeing this sustained increase in buyer demand have any impact on pricing. For the quarter, prices were mixed, with the average down almost 2% and the median up 1%. The same was true for the rolling year, where the average price fell over 1% and the median was flat. As we’ve said before in this Report, Bergen County prices have been flat for almost eight years now, after the sharp correction in 2008‑09. It might be that the demand is simply stronger in the lower‑priced markets, which is driving the average and median price down by changing the mix of properties sold. If that’s the case, then it’s just a matter of time before prices start to go up.
Inventory. Bergen inventory continues to tighten, with the number of available single‑family homes falling 26% and the months of inventory now below the six‑month mark that usually denotes a “tight” market. Indeed, declining inventory might be contributing to the relative slackness in sales, if buyers are on the sidelines waiting for new homes to hit the market.
Condominiums. Bergen condo sales and prices were both up sharply, demonstrating that buyer demand in the county might be particularly strong in the entry‑level markets. Condo sales were up almost 7%, and pricing was up 4% on average and 5% at the median. This continues a long‑term trend we’ve been watching, with the rolling year average price up almost 5% and the median up 3%. Those are sustainable price increases, and probably foreshadow what we’ll see next year with single‑family homes.
Going forward, we remain confident that Bergen County is slowly moving into a strong seller’s market. Although we are not yet seeing price appreciation in the single‑family market, we expect that increases in buyer demand, coupled with a decline of inventory, will eventually drive modest but meaningful appreciation by mid-2017.
To learn more about Better Homes and Gardens Rand Realty, visit their website and Facebook page, and make sure to “Like” their page. You can also follow them on Twitter.
Real Estate Market Report: Third Quarter 2016 – Northern New Jersey Market Overview
 The Northern New Jersey housing market plateaued in the third quarter of 2016, with sales flattening out after a torrid start to the year and pricing struggling to gain traction. With inventory levels falling throughout the region, though, we expect that the market might gain strength going into 2017.
Sales were basically flat throughout the region. After a strong start to the year, sales slowed during the third quarter, rising only about 2%. The good news is that if you look at the rolling year, sales were up almost 10%, continuing a trend we’ve been watching for about five years. Although we are not yet at transactional levels that we saw during the last seller’s market of the mid‑2000’s, sales are up about 40% from the bottom of the market in 2009 and are moving in a positive direction.
We are also seeing inventory continue to tighten. The industry measures the impact of inventory by calculating the “months of inventory” remaining on the market: i.e., the number of homes for sale divided by the average monthly transactions. According to industry standards, six months worth of inventory signals a balanced market: any less, and we are likely to see too many buyers chasing too few homes, which will tend to lead to multiple offer situations, then bidding wars, and ultimately higher prices. And that’s about where we are trending throughout the region, with regional inventory down over 25%. Indeed, Bergen is already below six months of inventory, and Morris, Essex, and Passaic are all below nine months.
Even with sales up and inventory down, though, average prices have been dropping throughout the region. We have been a little disappointed in the pricing this year, after what looked to be “green shoots” of price appreciation toward the end of 2015. Certainly, basic economics of supply and demand would tell us that after five years of steadily increasing buyer demand, we would expect to see some meaningful price increases. It might be that the market is simply stronger in the lower‑end than the middle‑ or higher‑end, which is changing the mix of properties sold and skewing the averages. Or it could still just be a matter of time before falling inventory and rising demand starts impacting pricing.
Going forward, we still believe that we are heading for a seller’s market. Sales have now been increasing for almost five years, which has brought inventory to the seller’s market threshold in much of the region. The economic fundamentals are all good: homes are priced at 2004 levels (without even adjusting for inflation), interest rates are still near historic lows, and the regional economy is stable. Accordingly, we continue to believe that better days are ahead, and that we are likely to see modest but meaningful price appreciation in 2017.
To learn more about Better Homes and Gardens Rand Realty, visit their website and Facebook page, and make sure to “Like” their page. You can also follow them on Twitter.
Real Estate Market Report: Third Quarter 2016 – Dutchess County, New York
 The Dutchess County housing market continued to strengthen in the third quarter of 2016, with a moderate increase in sales coupled with an eye‑opening spike in pricing.
Sales. Dutchess single‑family home sales were up again in the third quarter, rising 8% from last year. This marked the eighth quarter in a row with year‑on‑year sales increases, closing a rolling year where sales were up over 17%. With over 2,400 sales over the past 12 months, Dutchess is now closing homes at a rate that rivals what we saw during the last seller’s market.
Prices. This sustained increase in sales activity is finally having its expected impact on pricing. Single‑family home prices spiked in the third quarter, rising an eye‑popping 9% on average. That’s not a sustainable increase, and is likely due to a few outliers in the data, especially when you see that the median and price‑per‑square foot metrics were up a more modest 2%. But even so, the rolling year average sales price increase of 4%, and the median price increase of 3%, are both positive indicators of where this market is likely going.
Negotiability. Dutchess inventory continues to decline, now down over 26% to 14.1 months of active single‑family listings. Although we are nowhere near the six‑month level of inventory that usually signals a “seller’s market,” we are certainly seeing some tightening that could support further price appreciation. The other negotiability indicators – days‑on‑market and listing retention – were mixed.
Condominiums. The condo market was also up, with sales rising almost 18% and prices also spiking. For the year, condo sales are up 21%, and pricing is up across the board, although the 9% increase in the average price is probably not sustainable.
Going forward, we continue to believe that Dutchess is on the precipice of meaningful price appreciation. With a stable economy, low interest rates, and homes still priced at appealing 2004 levels (without even controlling for inflation), we believe that Dutchess will finish the year strong and see even better days in 2017.
To learn more about Better Homes and Gardens Rand Realty, visit their website and Facebook page, and make sure to “Like” their page. You can also follow them on Twitter.
Real Estate Market Report: Third Quarter 2016 – Putnam County, New York
 The Putnam County housing market surged again in the third quarter of 2016, with sales way up and prices stabilizing after a summer spike.
Sales. Putnam sales were up again in the third quarter, with single‑family home closings up over 12% from last year and now up almost 22% for the year. The market is just sizzling, with transactions up in nine straight quarters and 17 out of the last 18. Similarly, condo sales were up almost 12%, and have risen almost 20% for the year. Putnam demand is strong right now.
Prices. Even with all this demand, though, we’re not seeing a dramatic impact on pricing. Single‑family home prices were basically flat for the quarter, down a tick on average and up almost 2% at the median. Condo pricing was downright scary, falling almost 20% on both the average and the median, but we caution that the Putnam condo market is very thin and can be skewed by outliers. Overall, though, it’s surprising that sustained buyer demand over almost five years has had so little impact on pricing.
Inventory. The good news for Putnam homeowners was that inventory was down again, falling almost 43% to 7.3 months of active single‑family listings and 4.7 months for condos. Anything below six months usually signifies a tight seller’s market, which would tend to drive the kind of appreciation we’ve been waiting for.
Negotiability. The negotiability indicators showed that sellers continue to gain leverage with buyers, with the listing retention rate rising and days‑on‑market falling for both single‑family and condo sellers. We would expect homes to continue to sell more quickly and for closer to the asking price if the market heats up.
Going forward, we do believe that the fundamentals of the market are strong, with demand high, prices at attractive levels, interest rates near historic lows, and a gradually improving economy. Accordingly, we expect the Putnam market to close the year strong, and to eventually drive some meaningful price appreciation.
To learn more about Better Homes and Gardens Rand Realty, visit their website and Facebook page, and make sure to “Like” their page. You can also follow them on Twitter.


