
 Facebook
 X
X
 Pinterest
 Copy Link
Homes in Westchester and the Hudson Valley are STILL Cheaper Than They Have Been in a Generation
Right now is a really great time to be buying a home in Westchester or the Hudson Valley.
Man, do I hate saying that. As I’ve explained before, I hate the phrase “great time to buy” for a couple of reasons.
First, people have different needs, and a market that’s great for one person might be terrible for another person.
Second, while markets tend to move together, we do see micro-markets (i.e., towns and villages) that defy larger trends. So while it might be a great time to buy in Village A, it might be not so great in Town B.
Third, and most importantly, though, “it’s a great time to buy!” just seems like a hack thing to say, the kind of thing that TERRIBLE real estate agents have said for generations to get unsuspecting and gullible people to buy an overpriced home. And I think that most people get suspicious when real estate agents talk like that.
So I understand if you’re skeptical. And that’s why I don’t want to just TELL you it’s a great time to buy, I want to SHOW you why it’s a great time to buy.
Specifically, I want to make this specific point: the monthly payment you need to buy an inflation-adjusted average priced home in Westchester and the Hudson Valley is as low as its been in a generation.
Think about what I’m saying for a second. I’m NOT saying that homes are cheaper than they’ve ever been. That’s not true. Depending on the year, homes have appreciated, and if you go back more than 15 years, they’ve appreciated pretty dramatically. I’m just saying that the MONTHLY PAYMENT you need to make to buy the AVERAGE PRICED HOME is lower right now than it’s been in a generation — if you control for the effects of inflation.
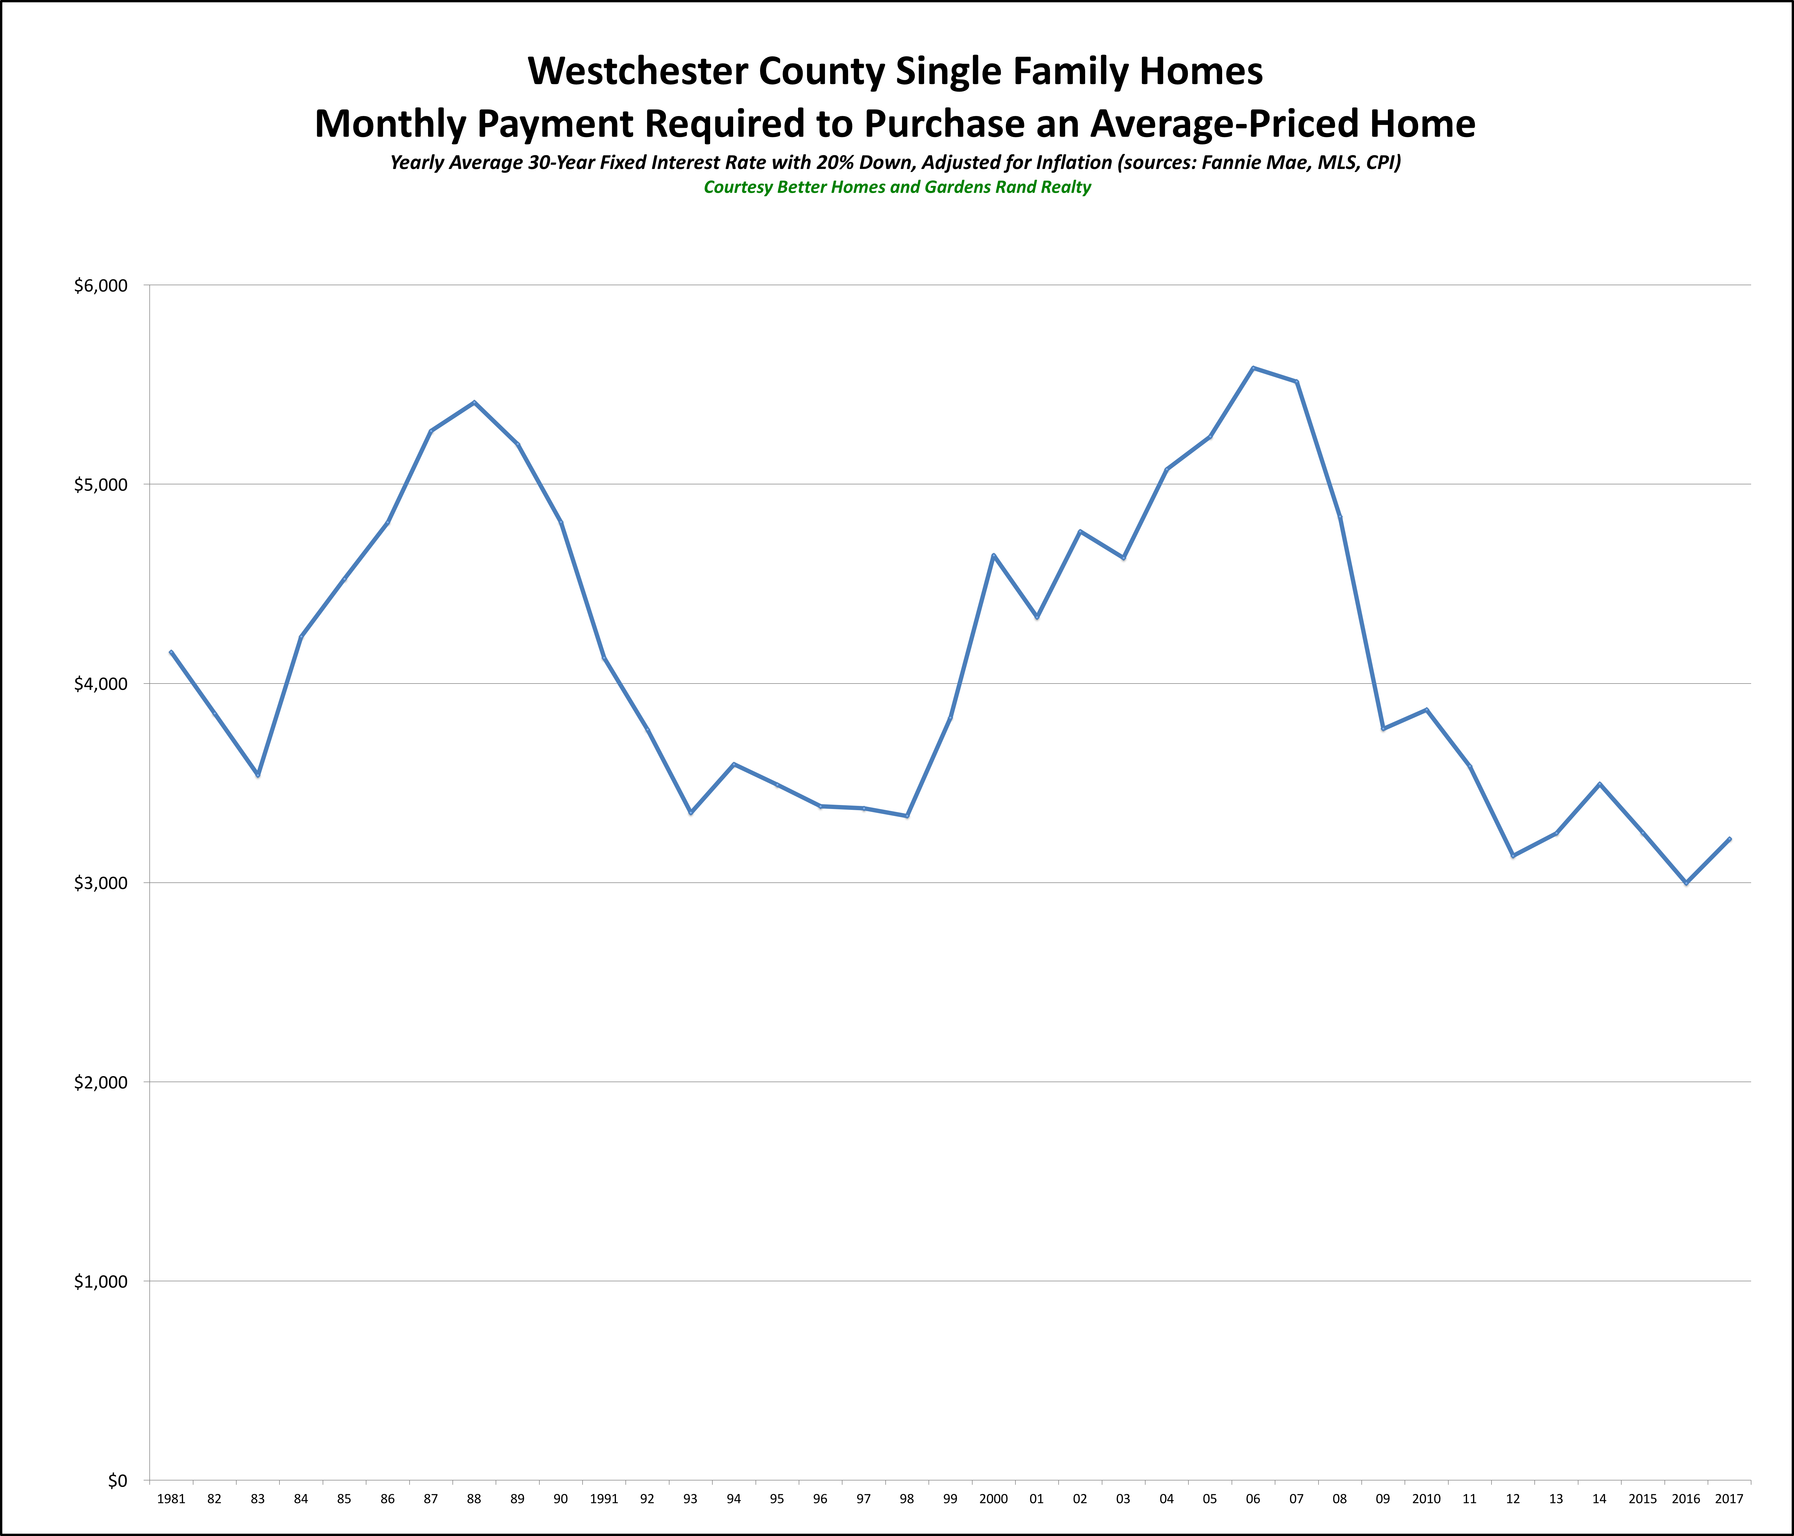
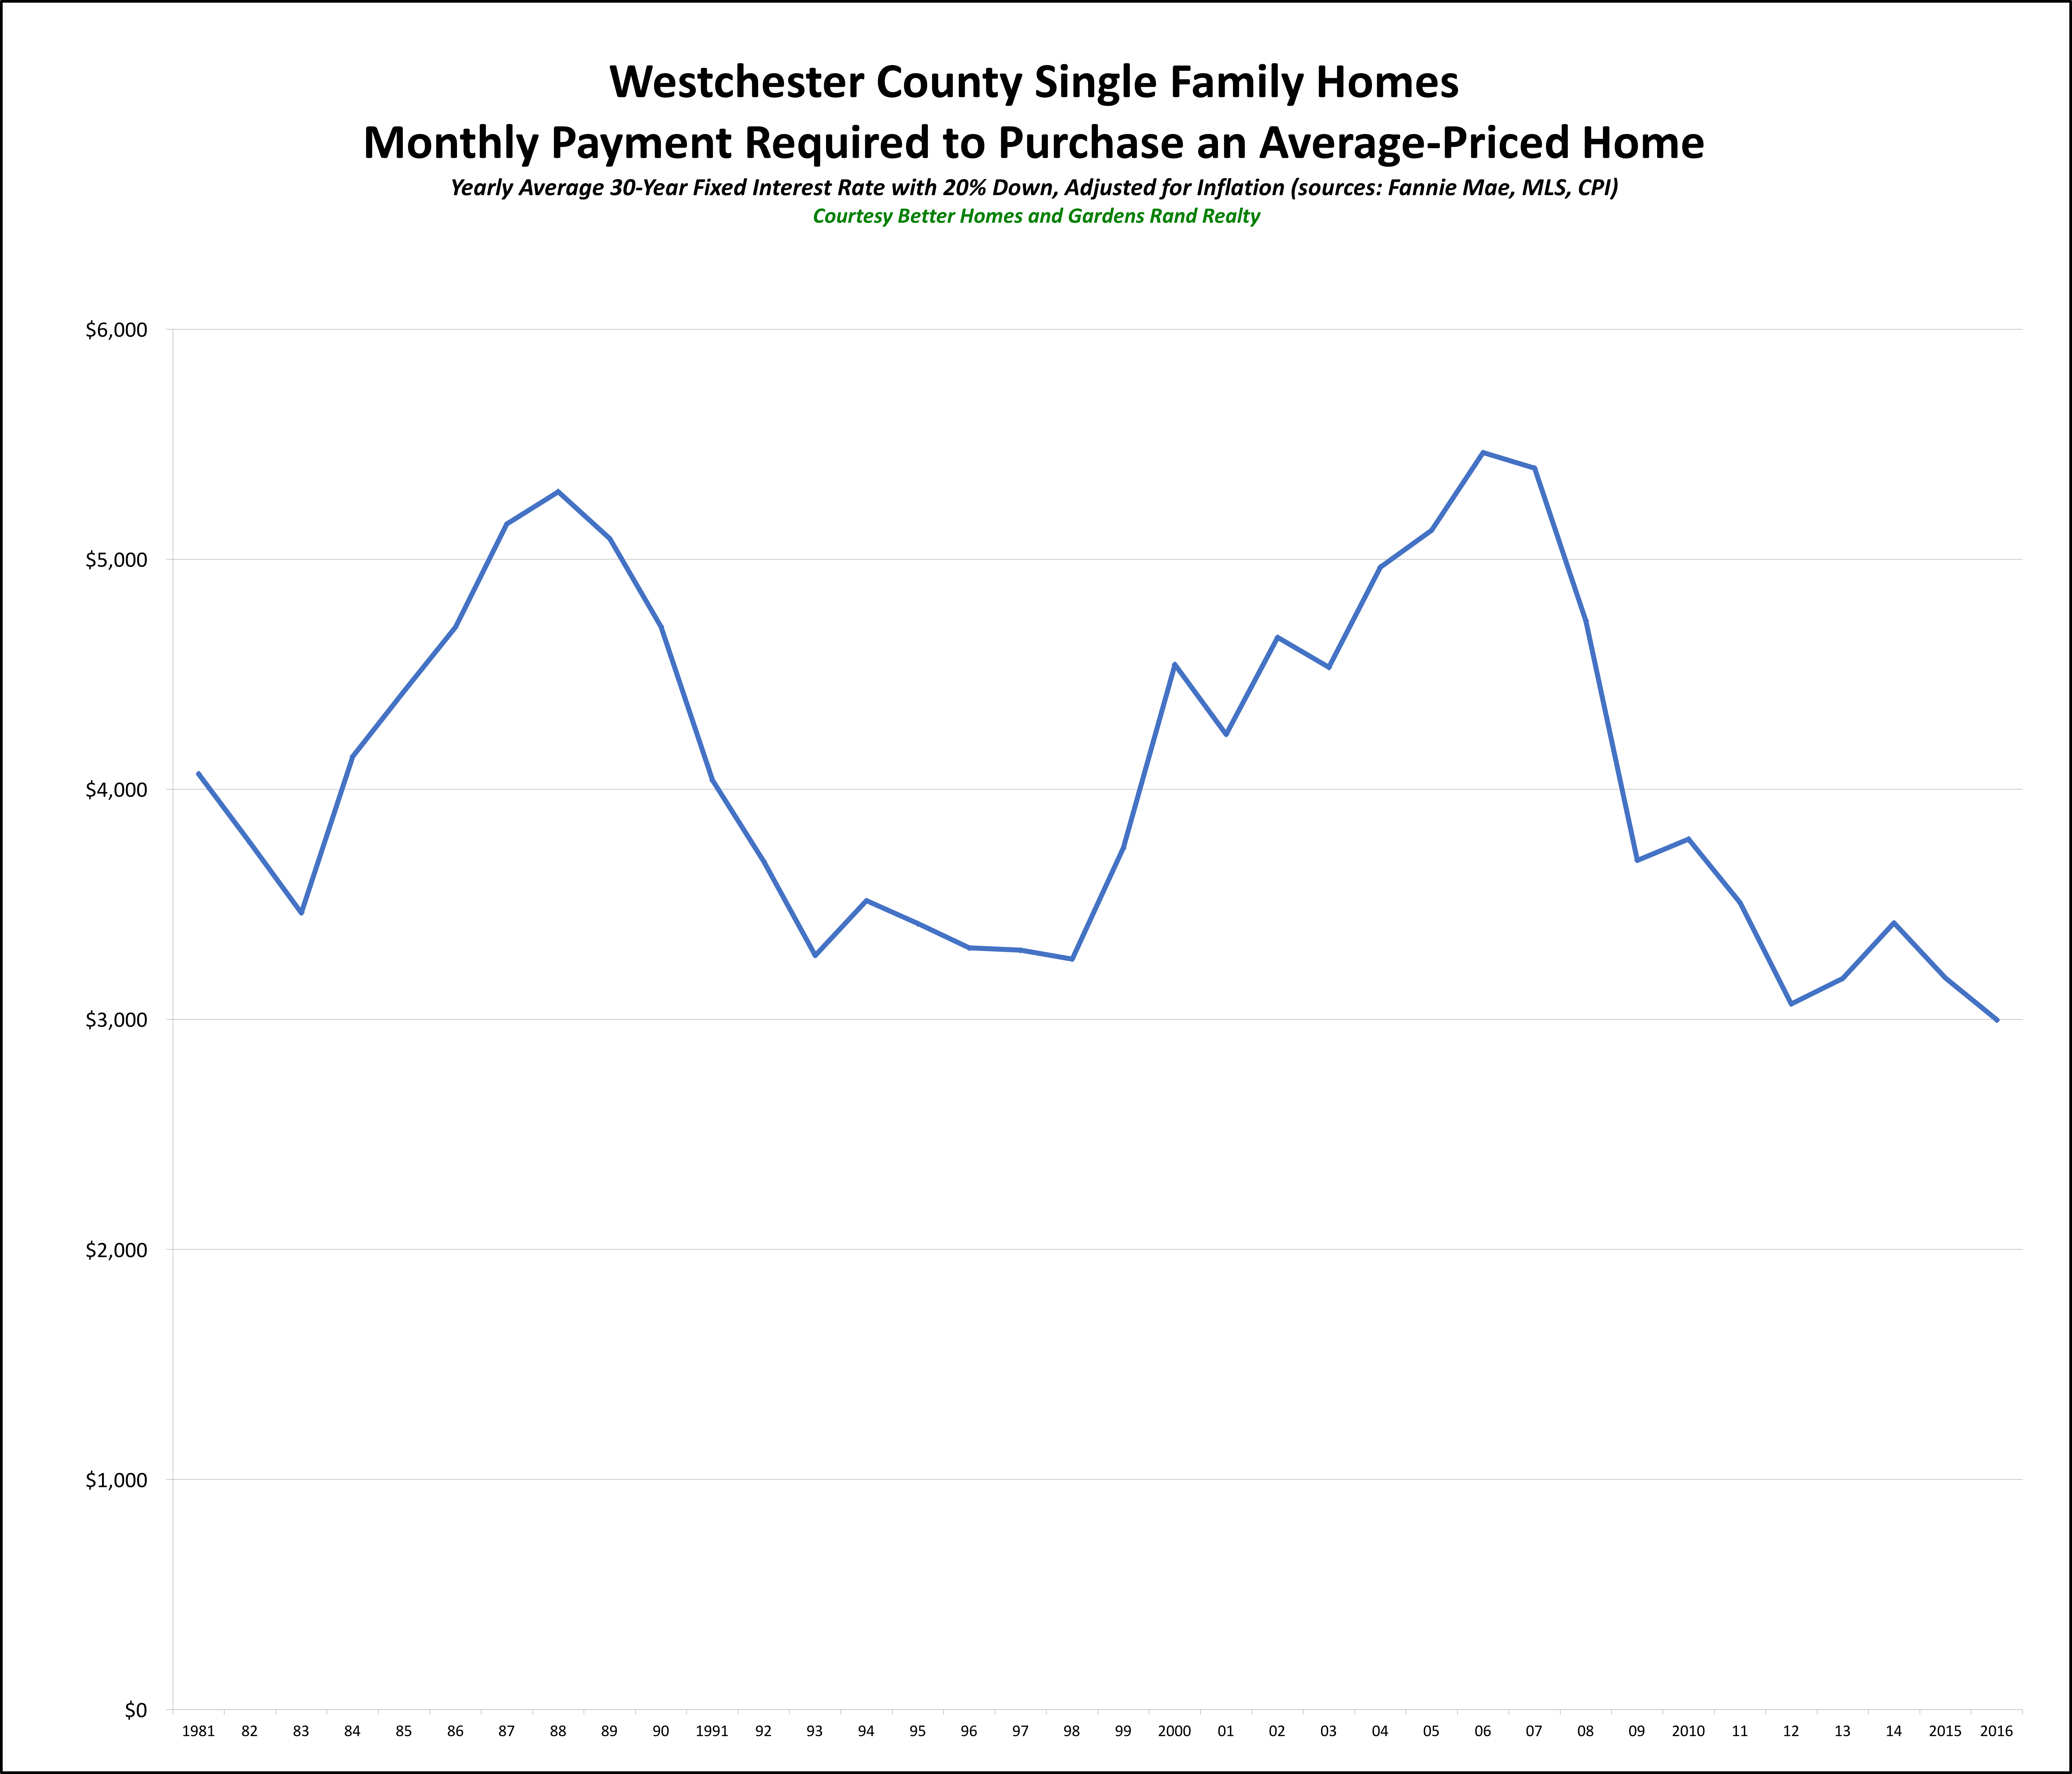
If you look at the graph below for Westchester County, you’ll see what I mean.
On that graph, as we’ve done before, we’ve plotted the monthly payment that a purchaser in the county would have to make to purchase the average-priced home at various points over the years. After all, affordability is not just a matter of the sales price – it’s a matter of the monthly payment you’re going to have to make, which is partly a function of the prevailing interest rate. And then to measure the change in the monthly payment over time, we factored in the effects of inflation.
So we took the following data points:
•The average price of a single family home up to the end of 2017 – from the local MLS data.
•The average interest rate for a 30-year fixed-rate mortgage for every calendar year up to 2017 – from Freddie Mac.
•The prevailing inflation rate for every calendar year up to 2017– from the US Department of Labor.
You can see the results on the graph. The monthly payment you have to make to purchase the average-priced home in Westchester is just about as low as it’s been in years. We saw the slightest uptick from 2012-2014, partially because of a slight increase in pricing and a slow inflating of interest rates. But the payment came down again over the past two years, with rates falling and prices stalling.
Generally, though, we’re talking about a monthly payment that is as low as anytime in the past 35 years – and as low as it was in the mid-1990s, during a crippling buyer’s market.
So why are monthly payments lower than they’ve been in a generation? A couple of reasons:
1) Prices. Part of it is that we have not seen prices go up in any measurable way in almost 10 years. Home prices peaked in 2006-08, lost about 25-30% of value from 2008-2010, and have bounced around a little since then. But they’re still around 2004 levels — without controlling for inflation.
2) Inflation. Ah, yes, inflation — the value of money goes down a little bit each year as inflation takes a bite. Now, inflation rates have been pretty low over the past 15 years from historical standards, but that little bit each year does add up.
3) Rates. But the biggest reason we’re seeing monthly payments lower than they’ve been in a generation is that rates are still at historic lows. After all, about ten years ago, the average interest rate was about 6%. For the past few years, it’s been below 4%. That’s a huge difference in your monthly payment.
And the same is true throughout the Hudson Valley. I showed you Westchester first because we have good data on prices for the county going back all the way to 1981. In other counties, our data doesn’t go back as far, but if we look at each of those counties you can see that it’s pretty much the same story for the time period we have.
Orange County. Here’s Orange County, where we have data going back to 1994:
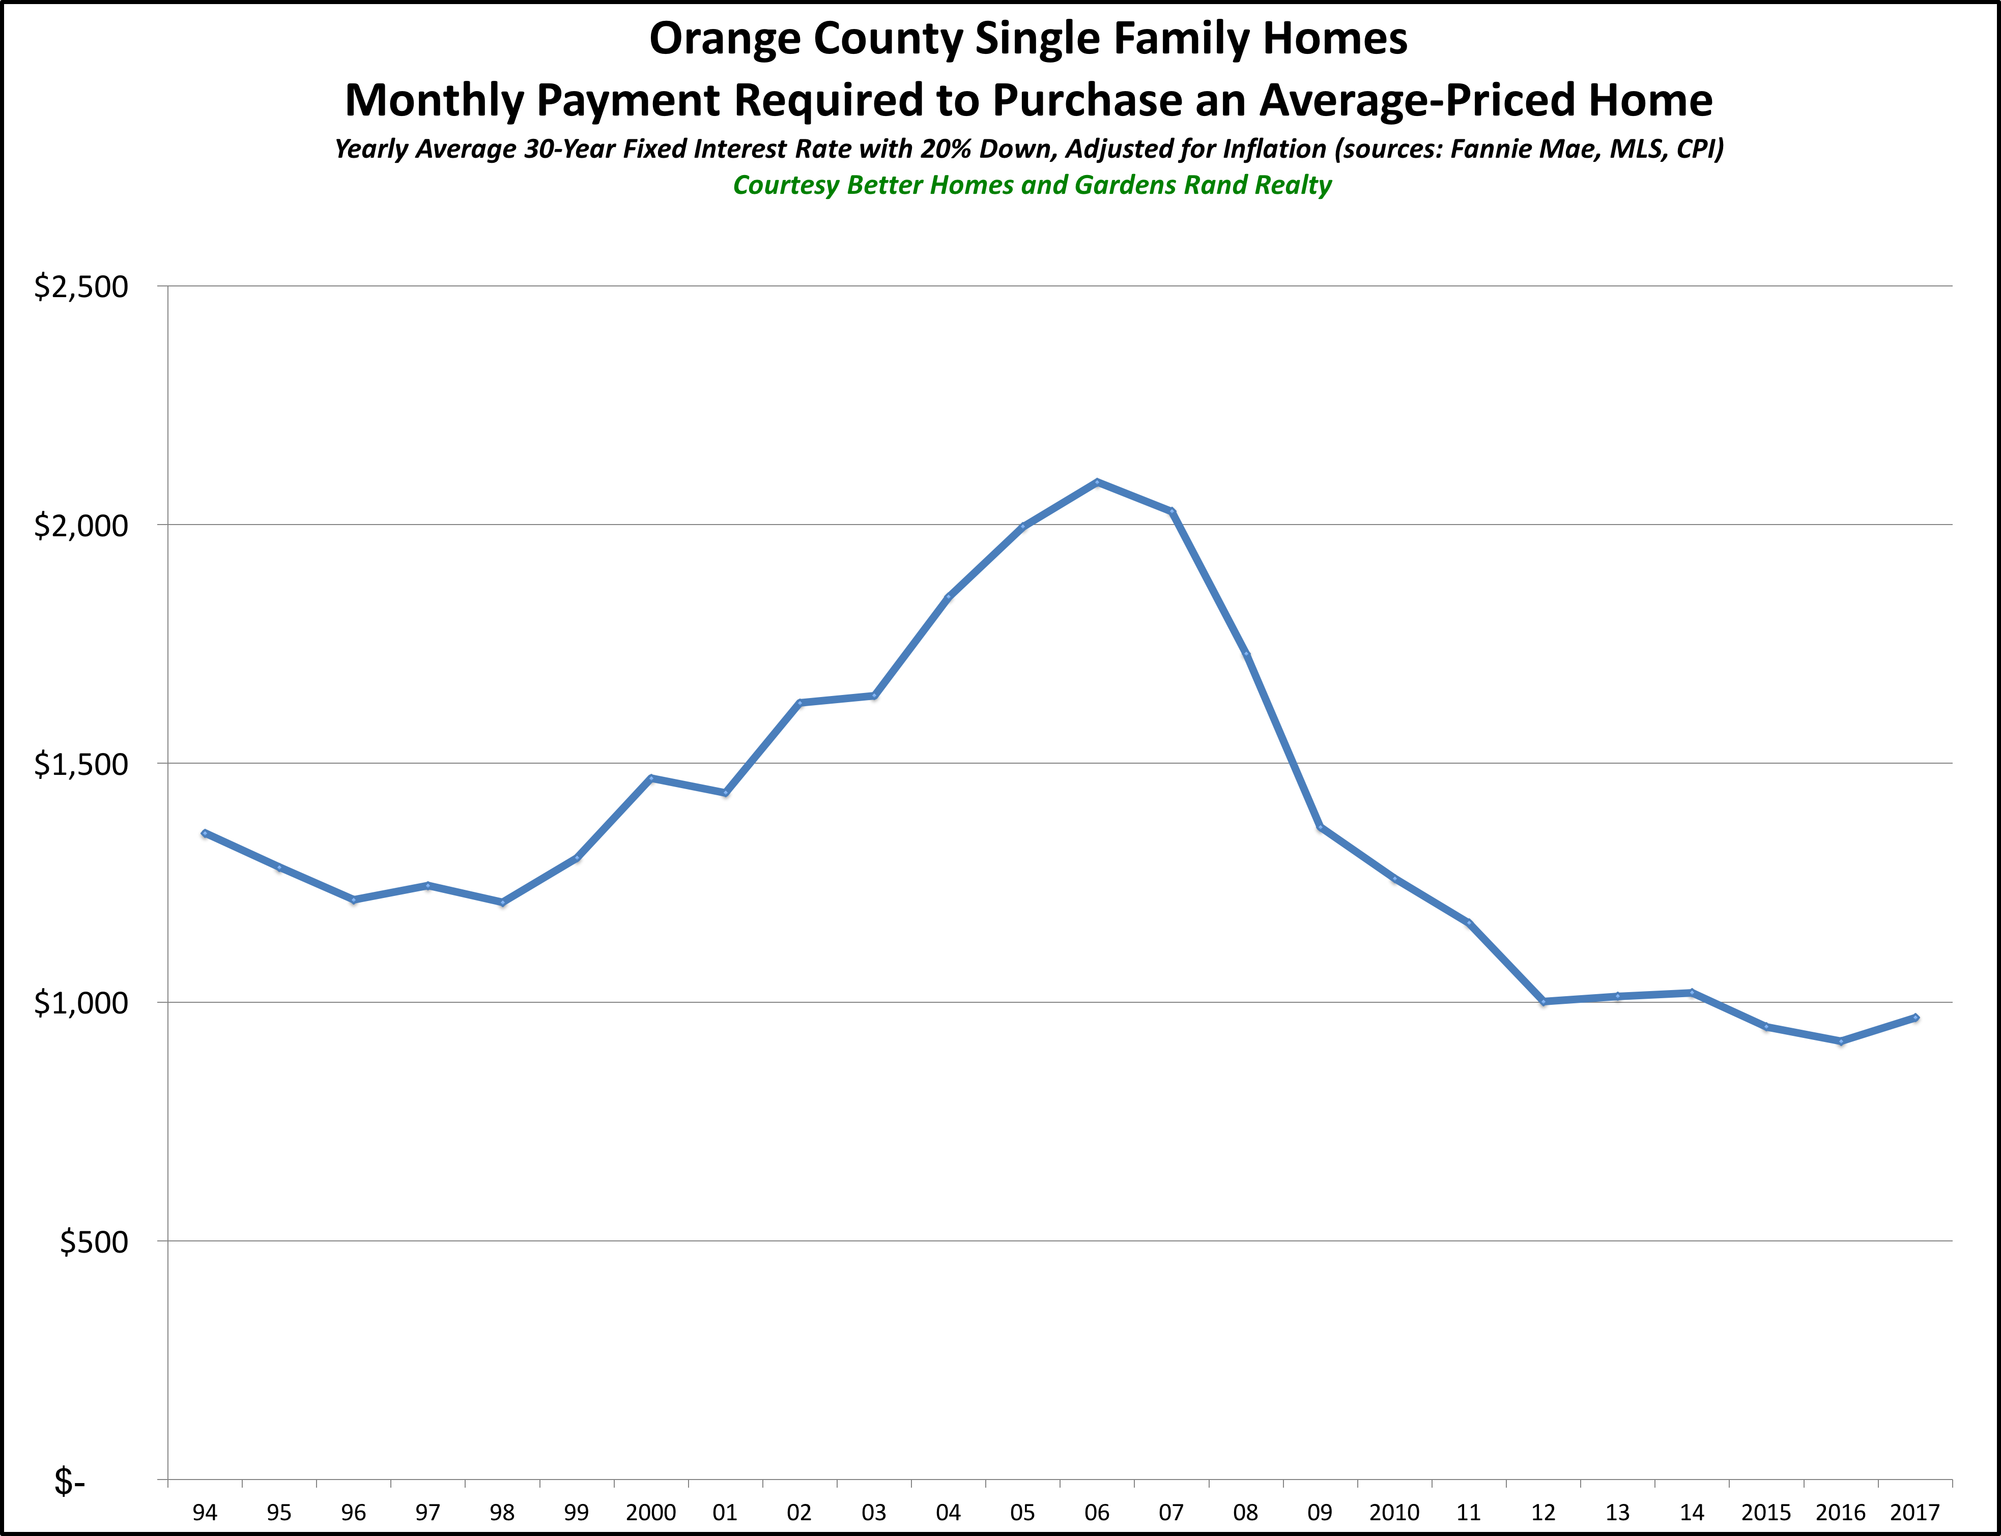
You can see that the monthly payment to buy an average-priced home in Orange County is lower right now than it’s been in over 20 years.
Rockland County. In Rockland, we have data going back to 2002, over 14 years of data.
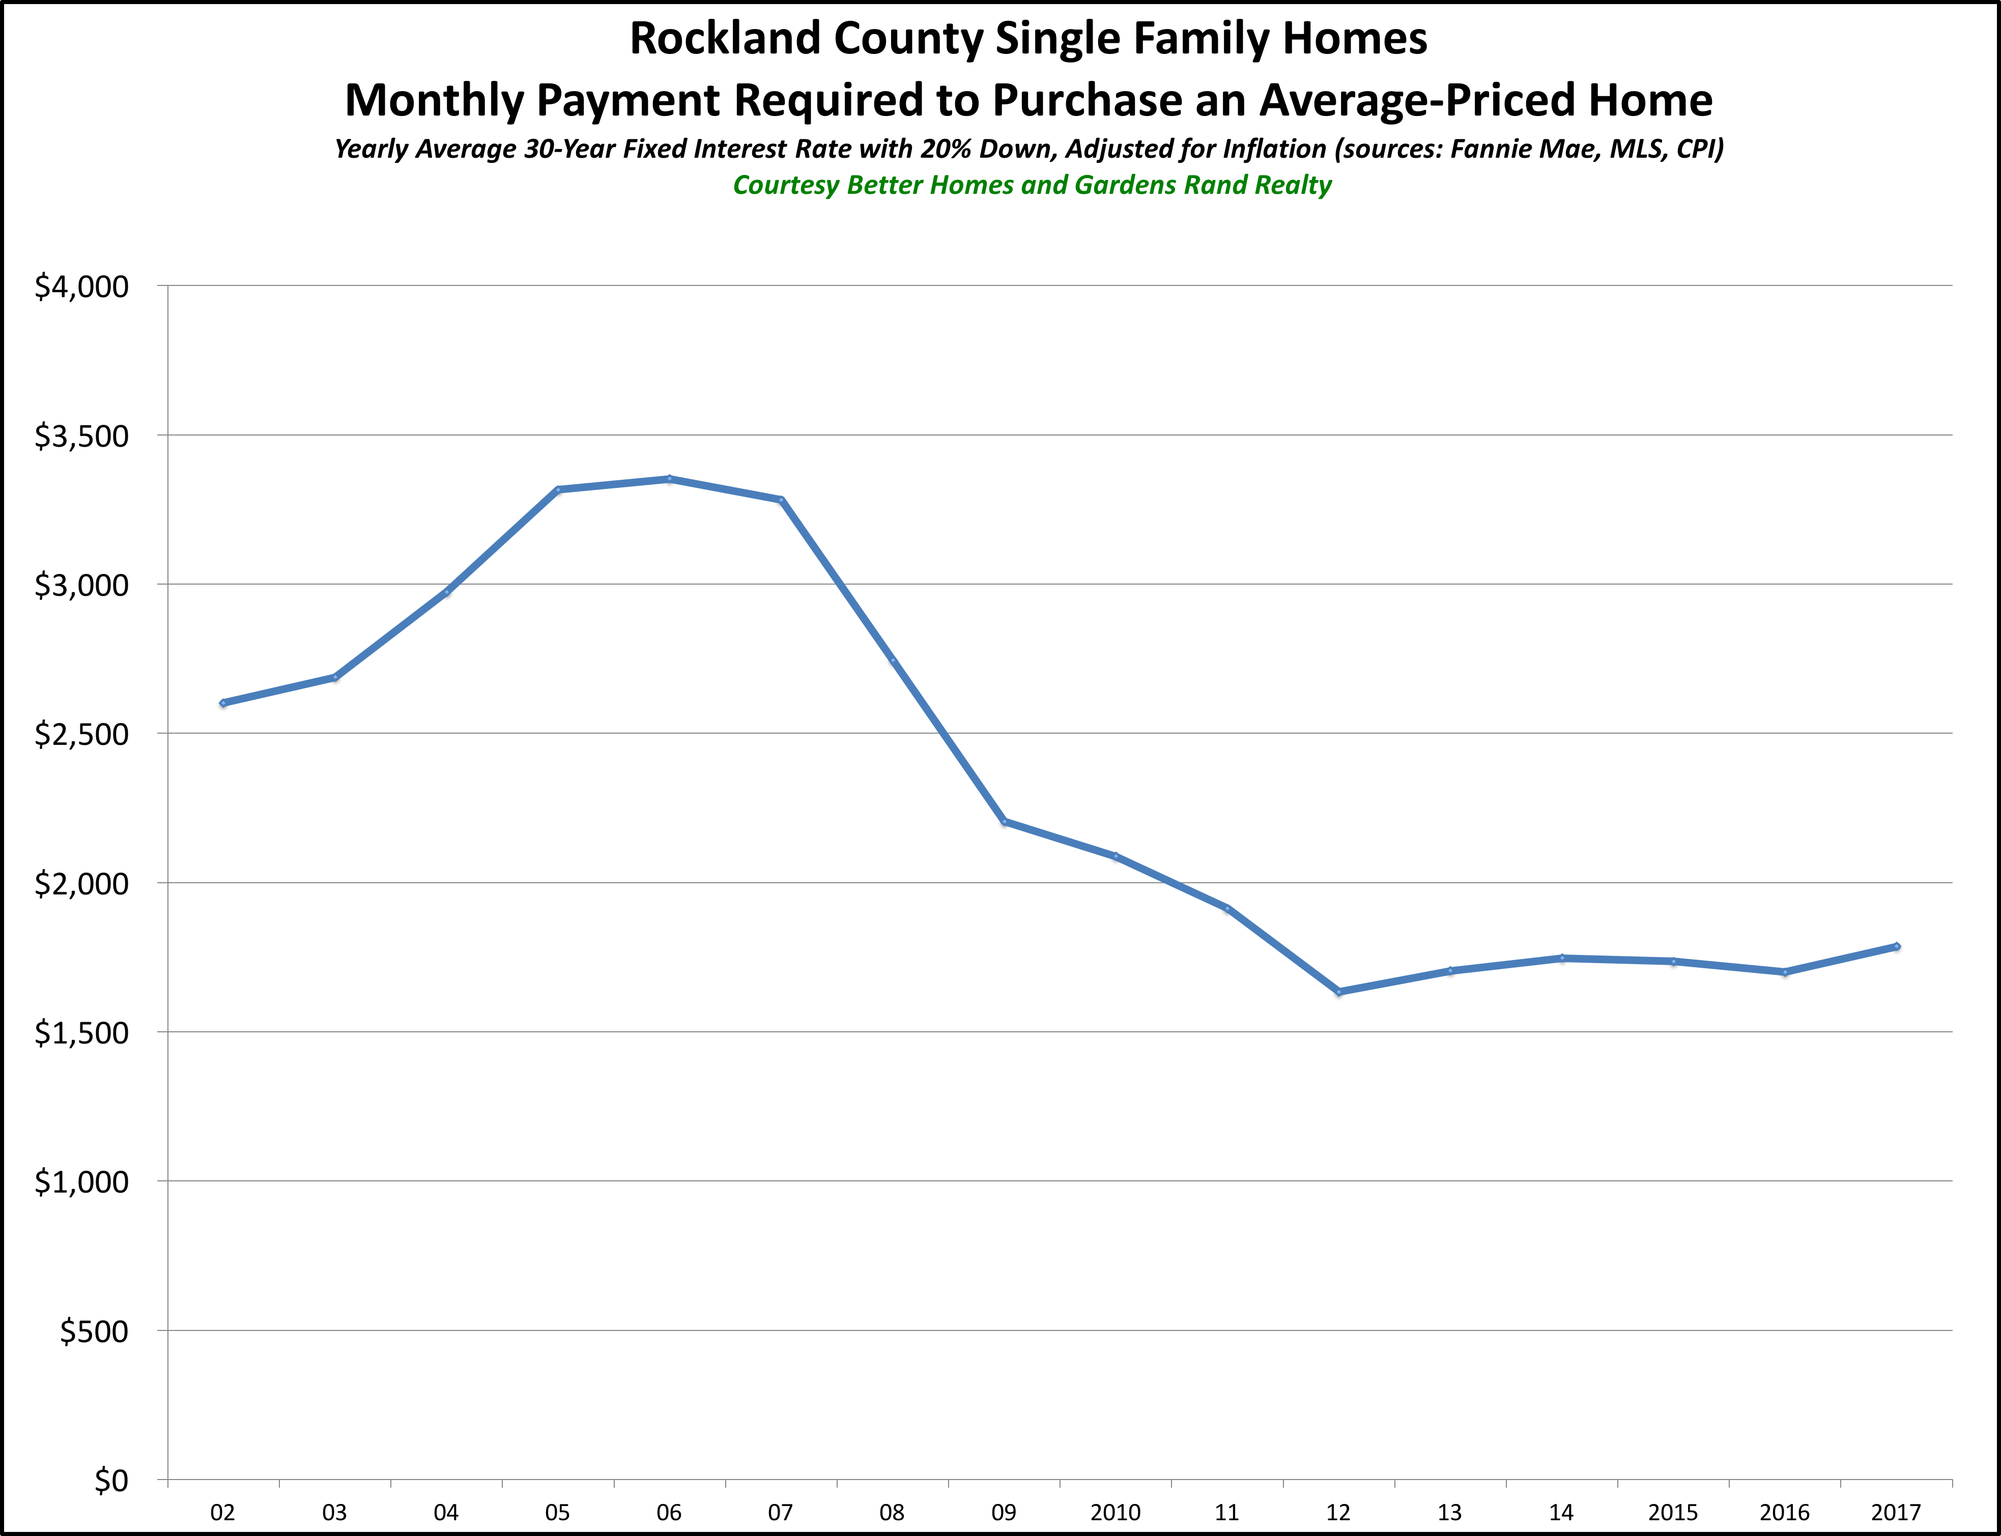
Again, you can see that even with a slight rise in the past few years, the monthly payment you have to make to buy the average-priced home in Rockland is lower right now than it’s been since at least 2002, and probably for quite a bit of time before that.
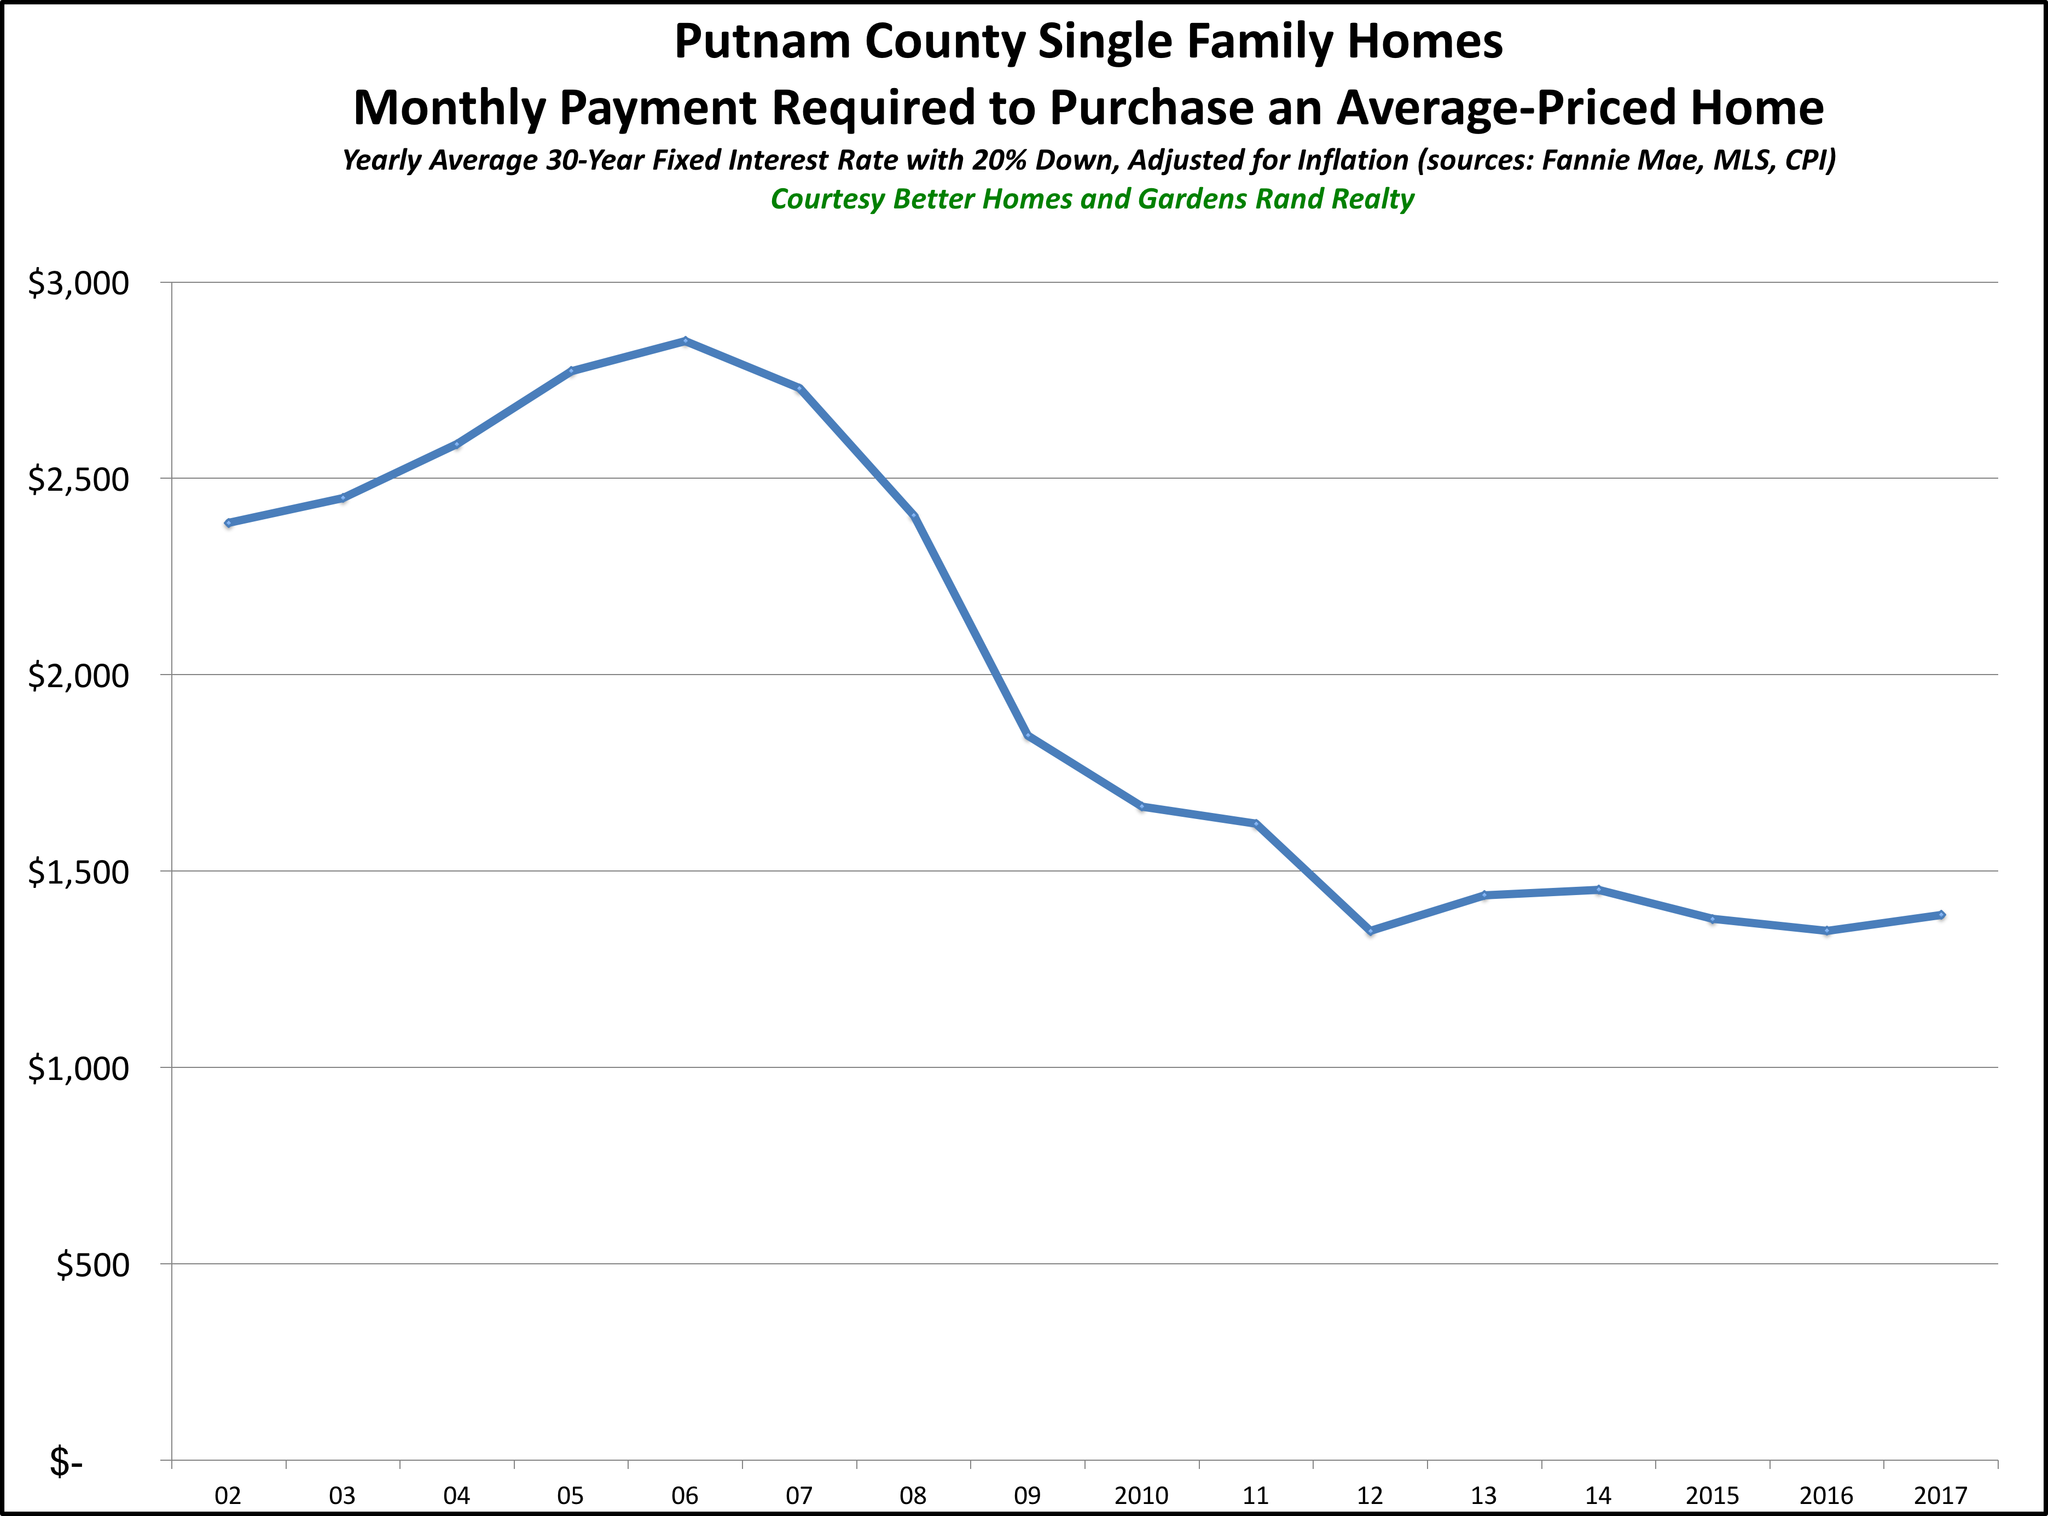
Putnam County. Similarly, we have data going back to 2002 in Putnam, and the story is the same:
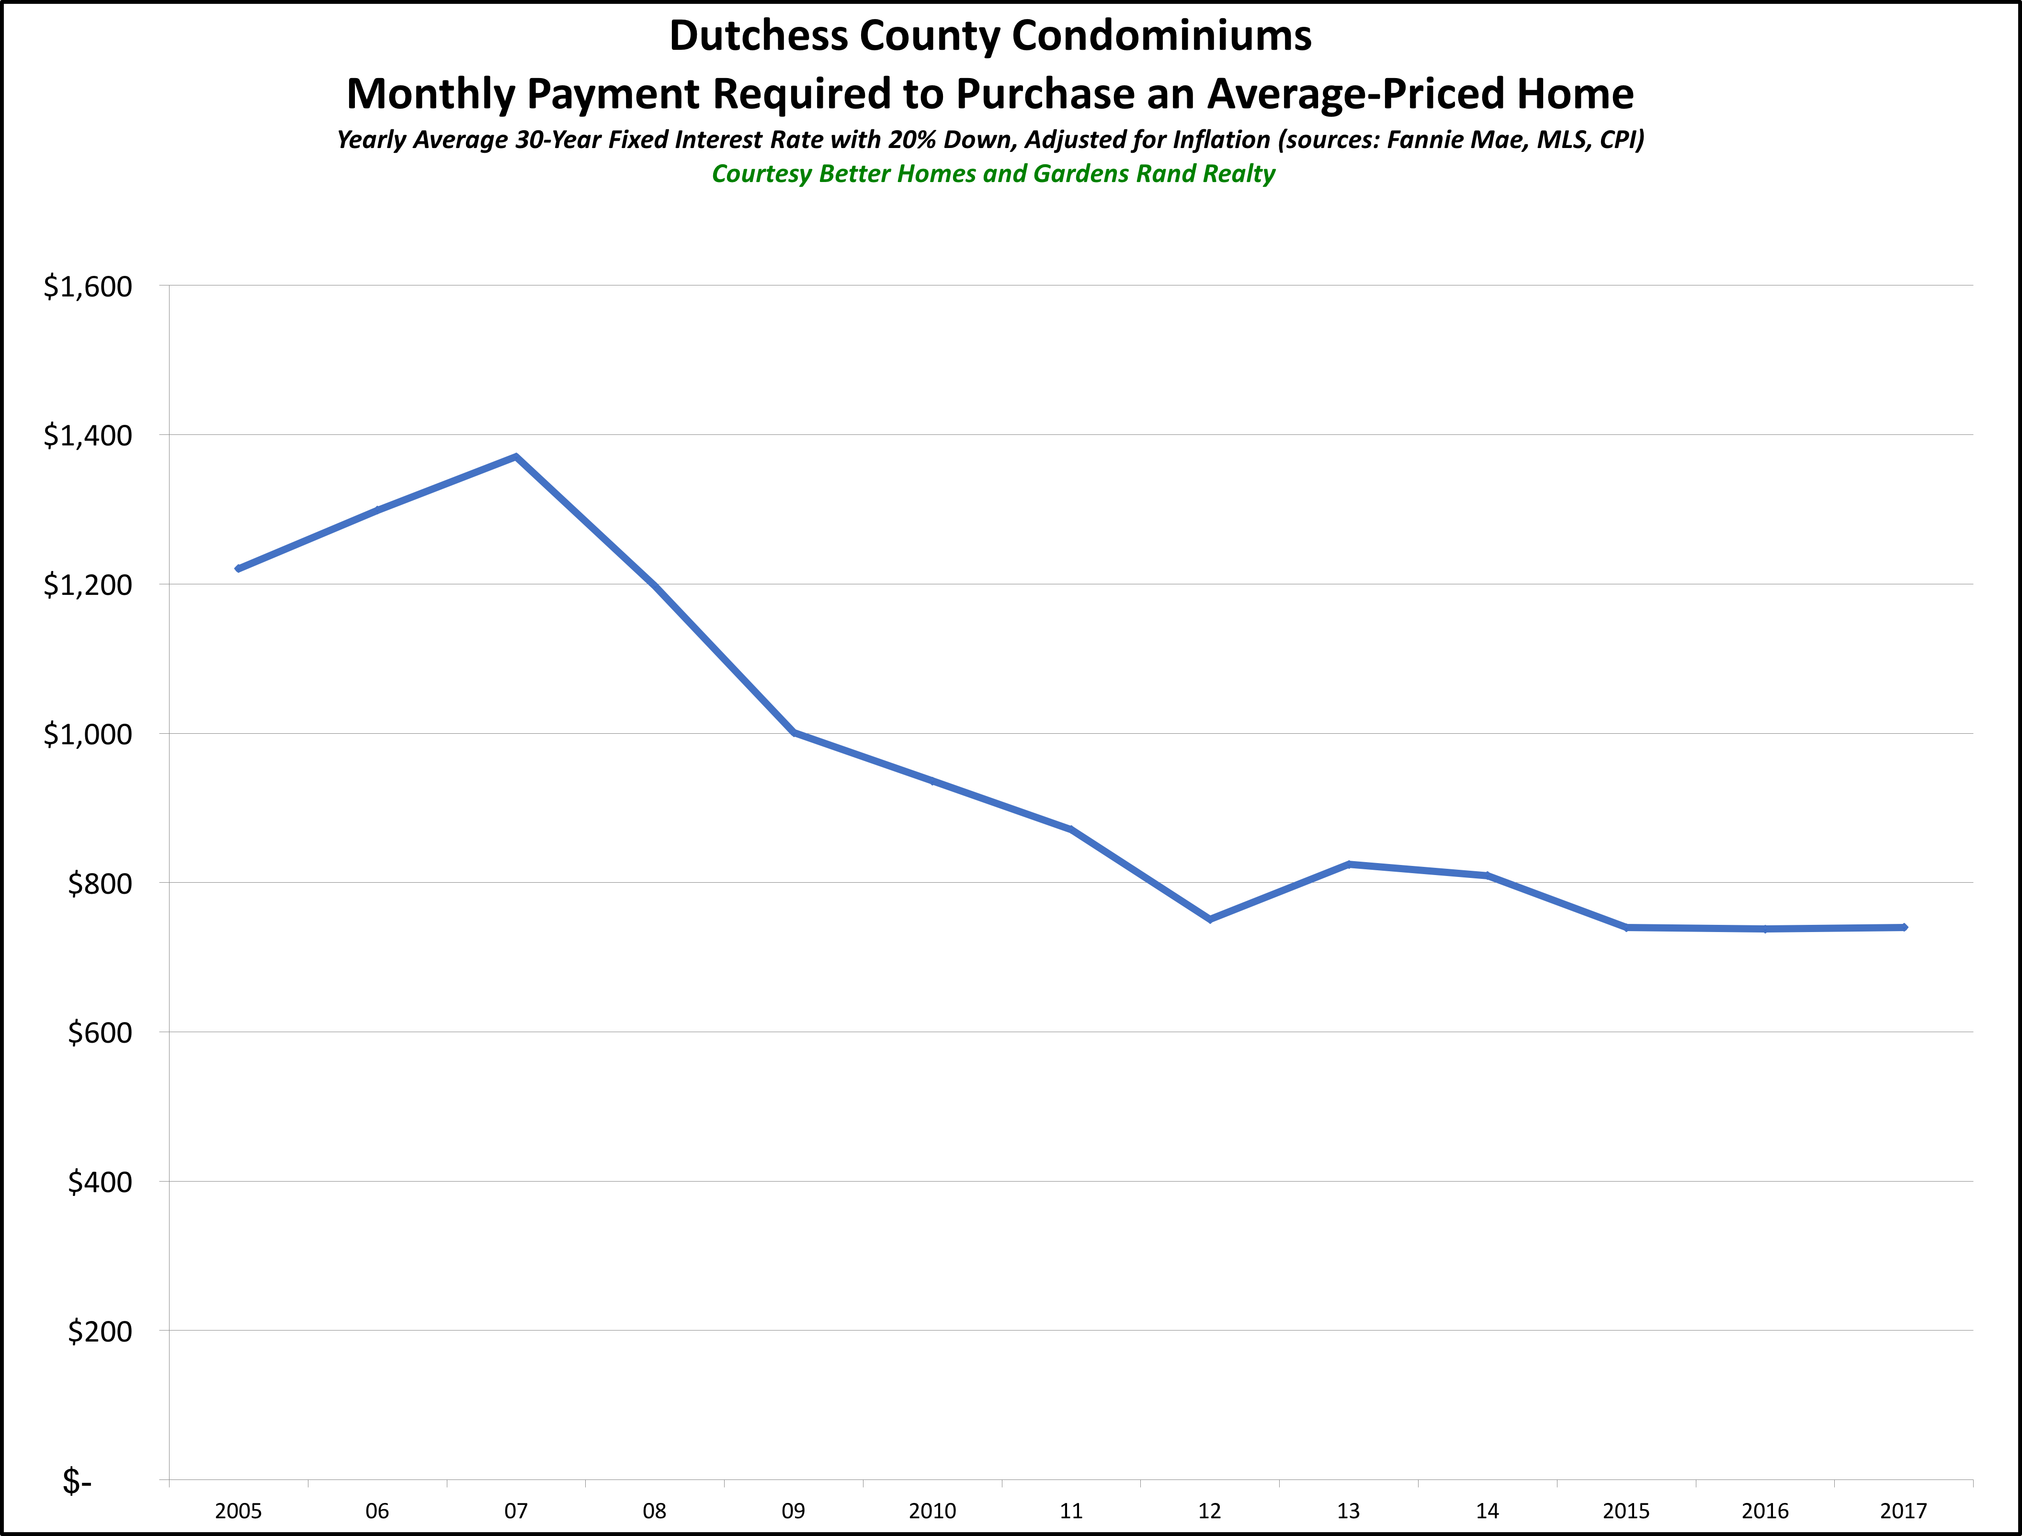
Dutchess County. Again, same story in Dutchess County for that same period:
And although we don’t have data for Orange, Rockland, Putnam, or Dutchess going back as far as Westchester, the fact that the curve over the recent decade or so is very consistent with Westchester’s results suggests that, like in Westchester, the monthly payment you need to make throughout the Hudson Valley is lower right now than it’s been since the Carter administration.
Condos and Coops. All that’s for single-family homes. What about condos and coops? Well, we don’t have data going back as far, but in each county, condos (and coops in Westchester) show the same trend — the monthly payment to buy an average priced condo or coop in the region is lower right now than it’s been at any time since the 2005 era. Here are the graphs:
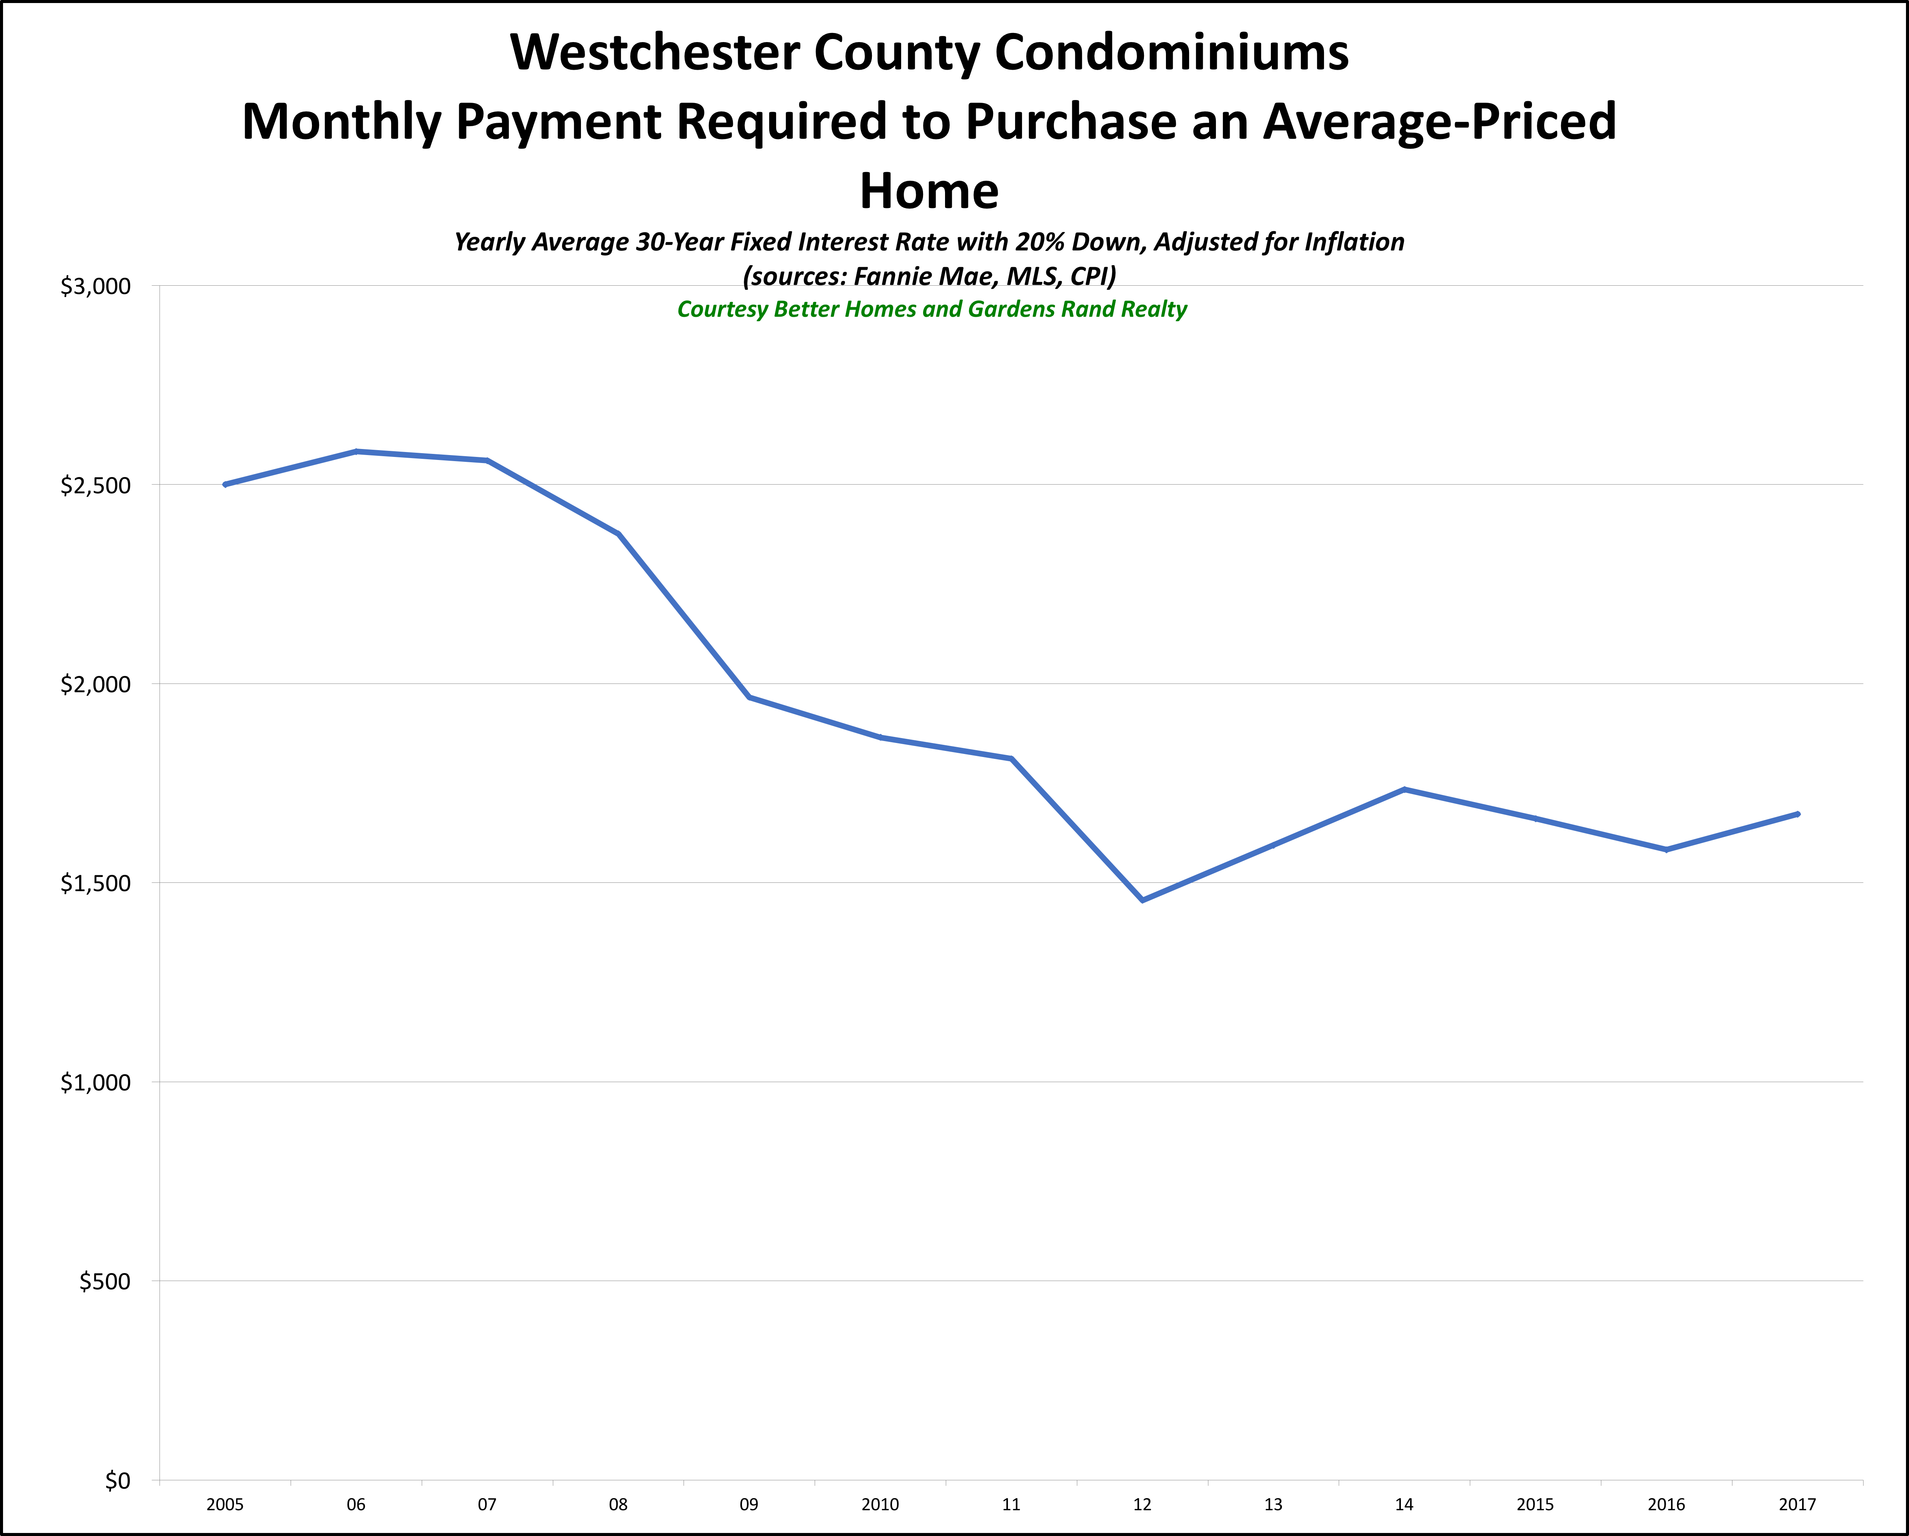
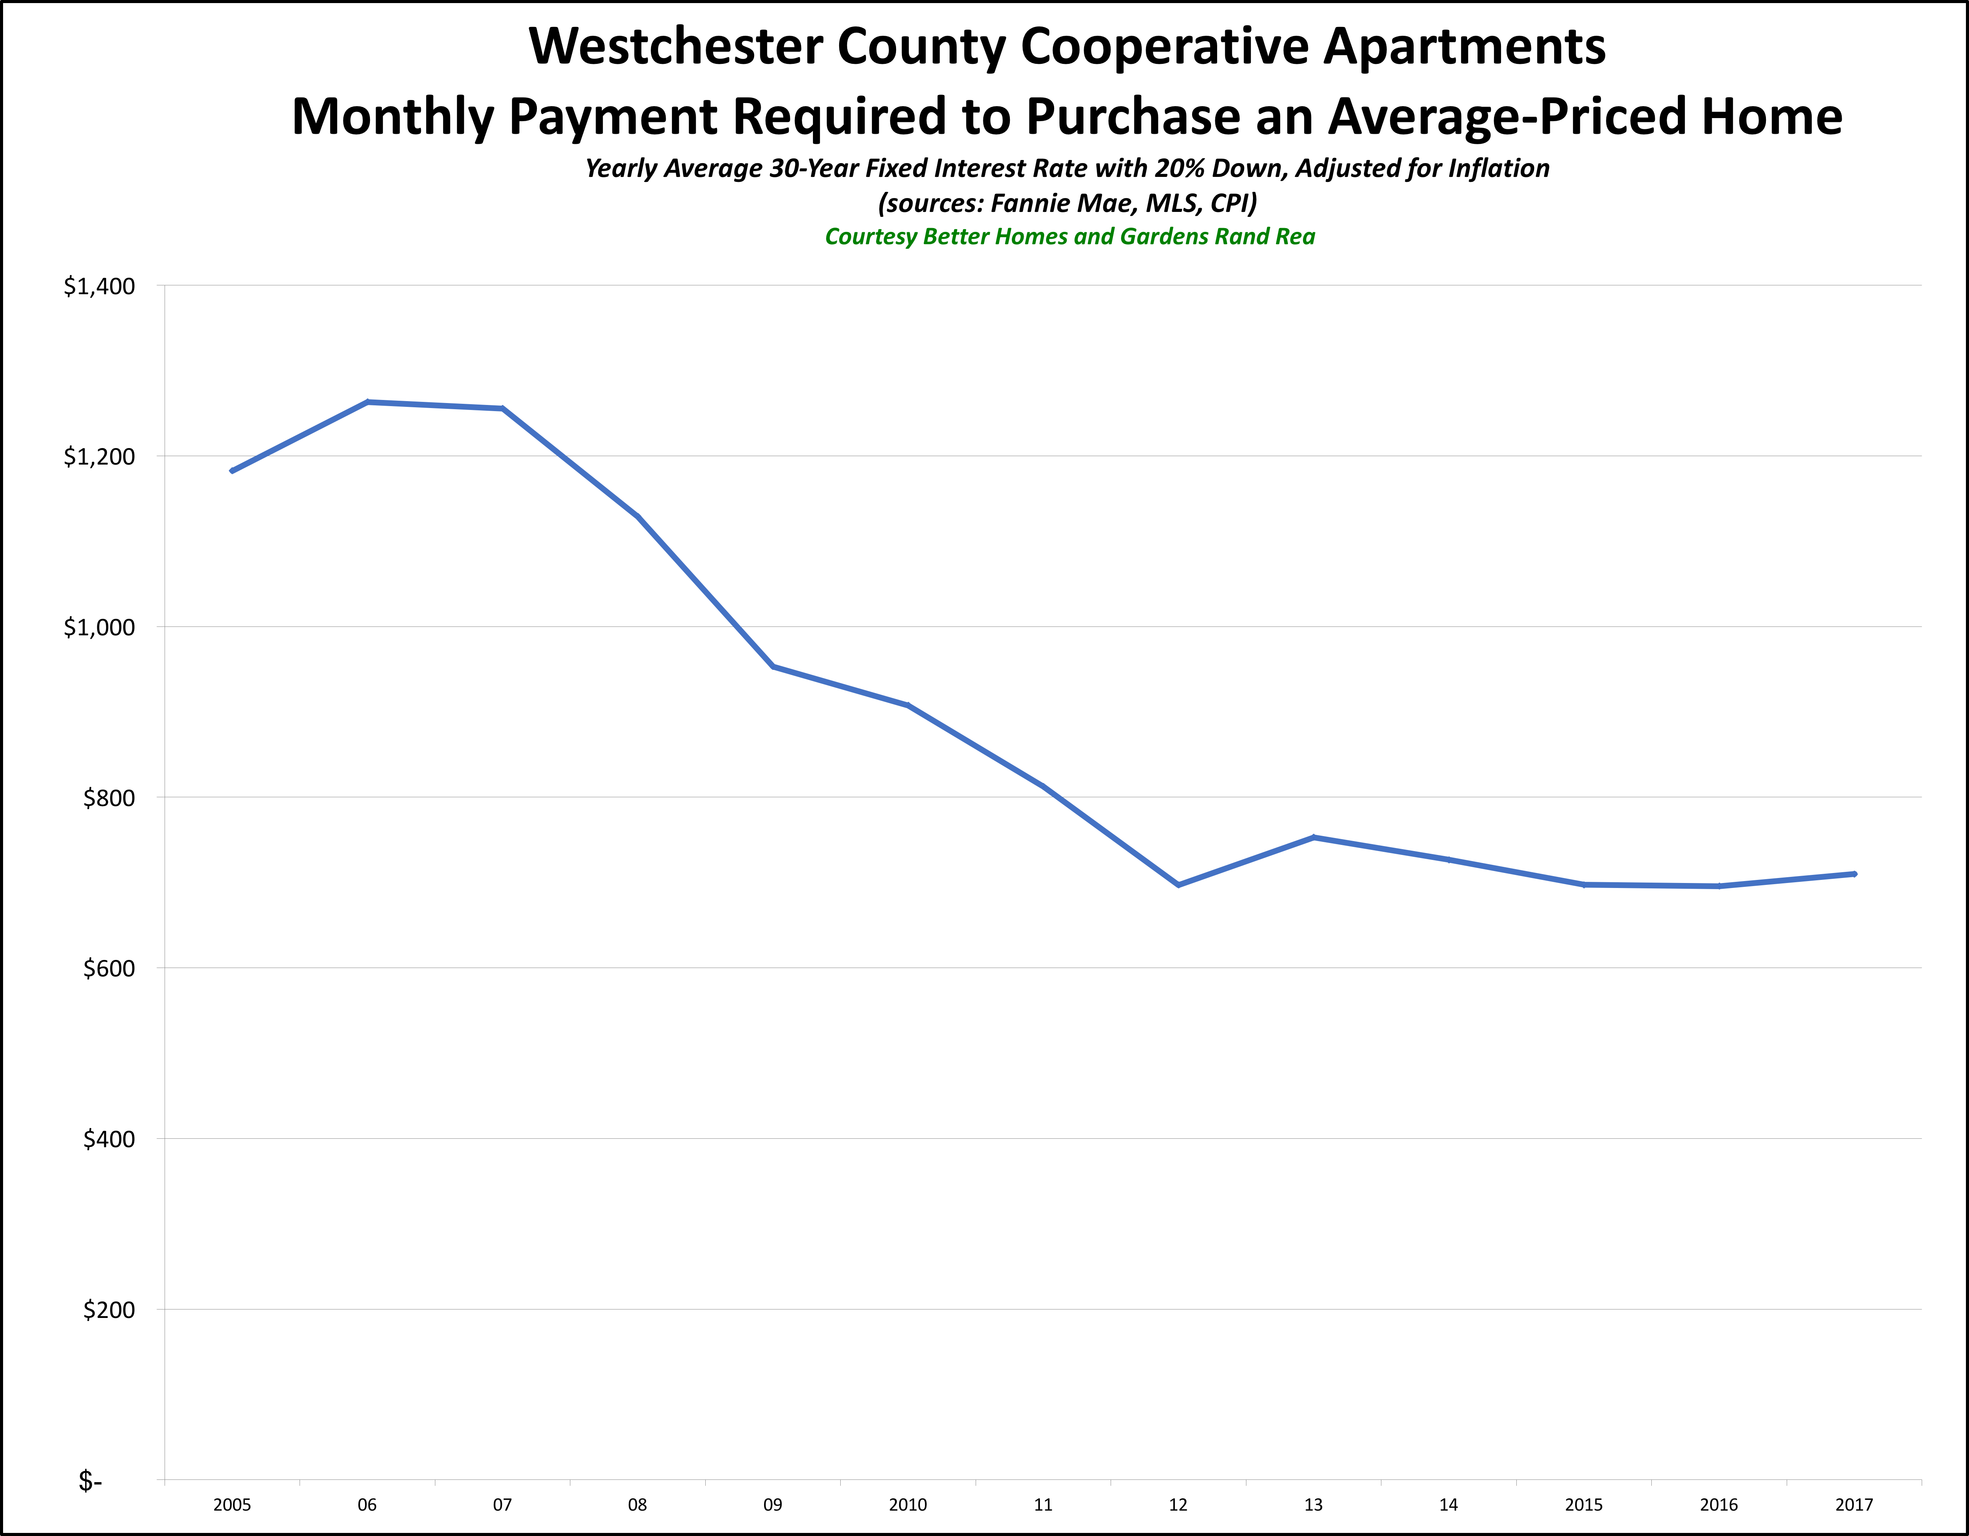
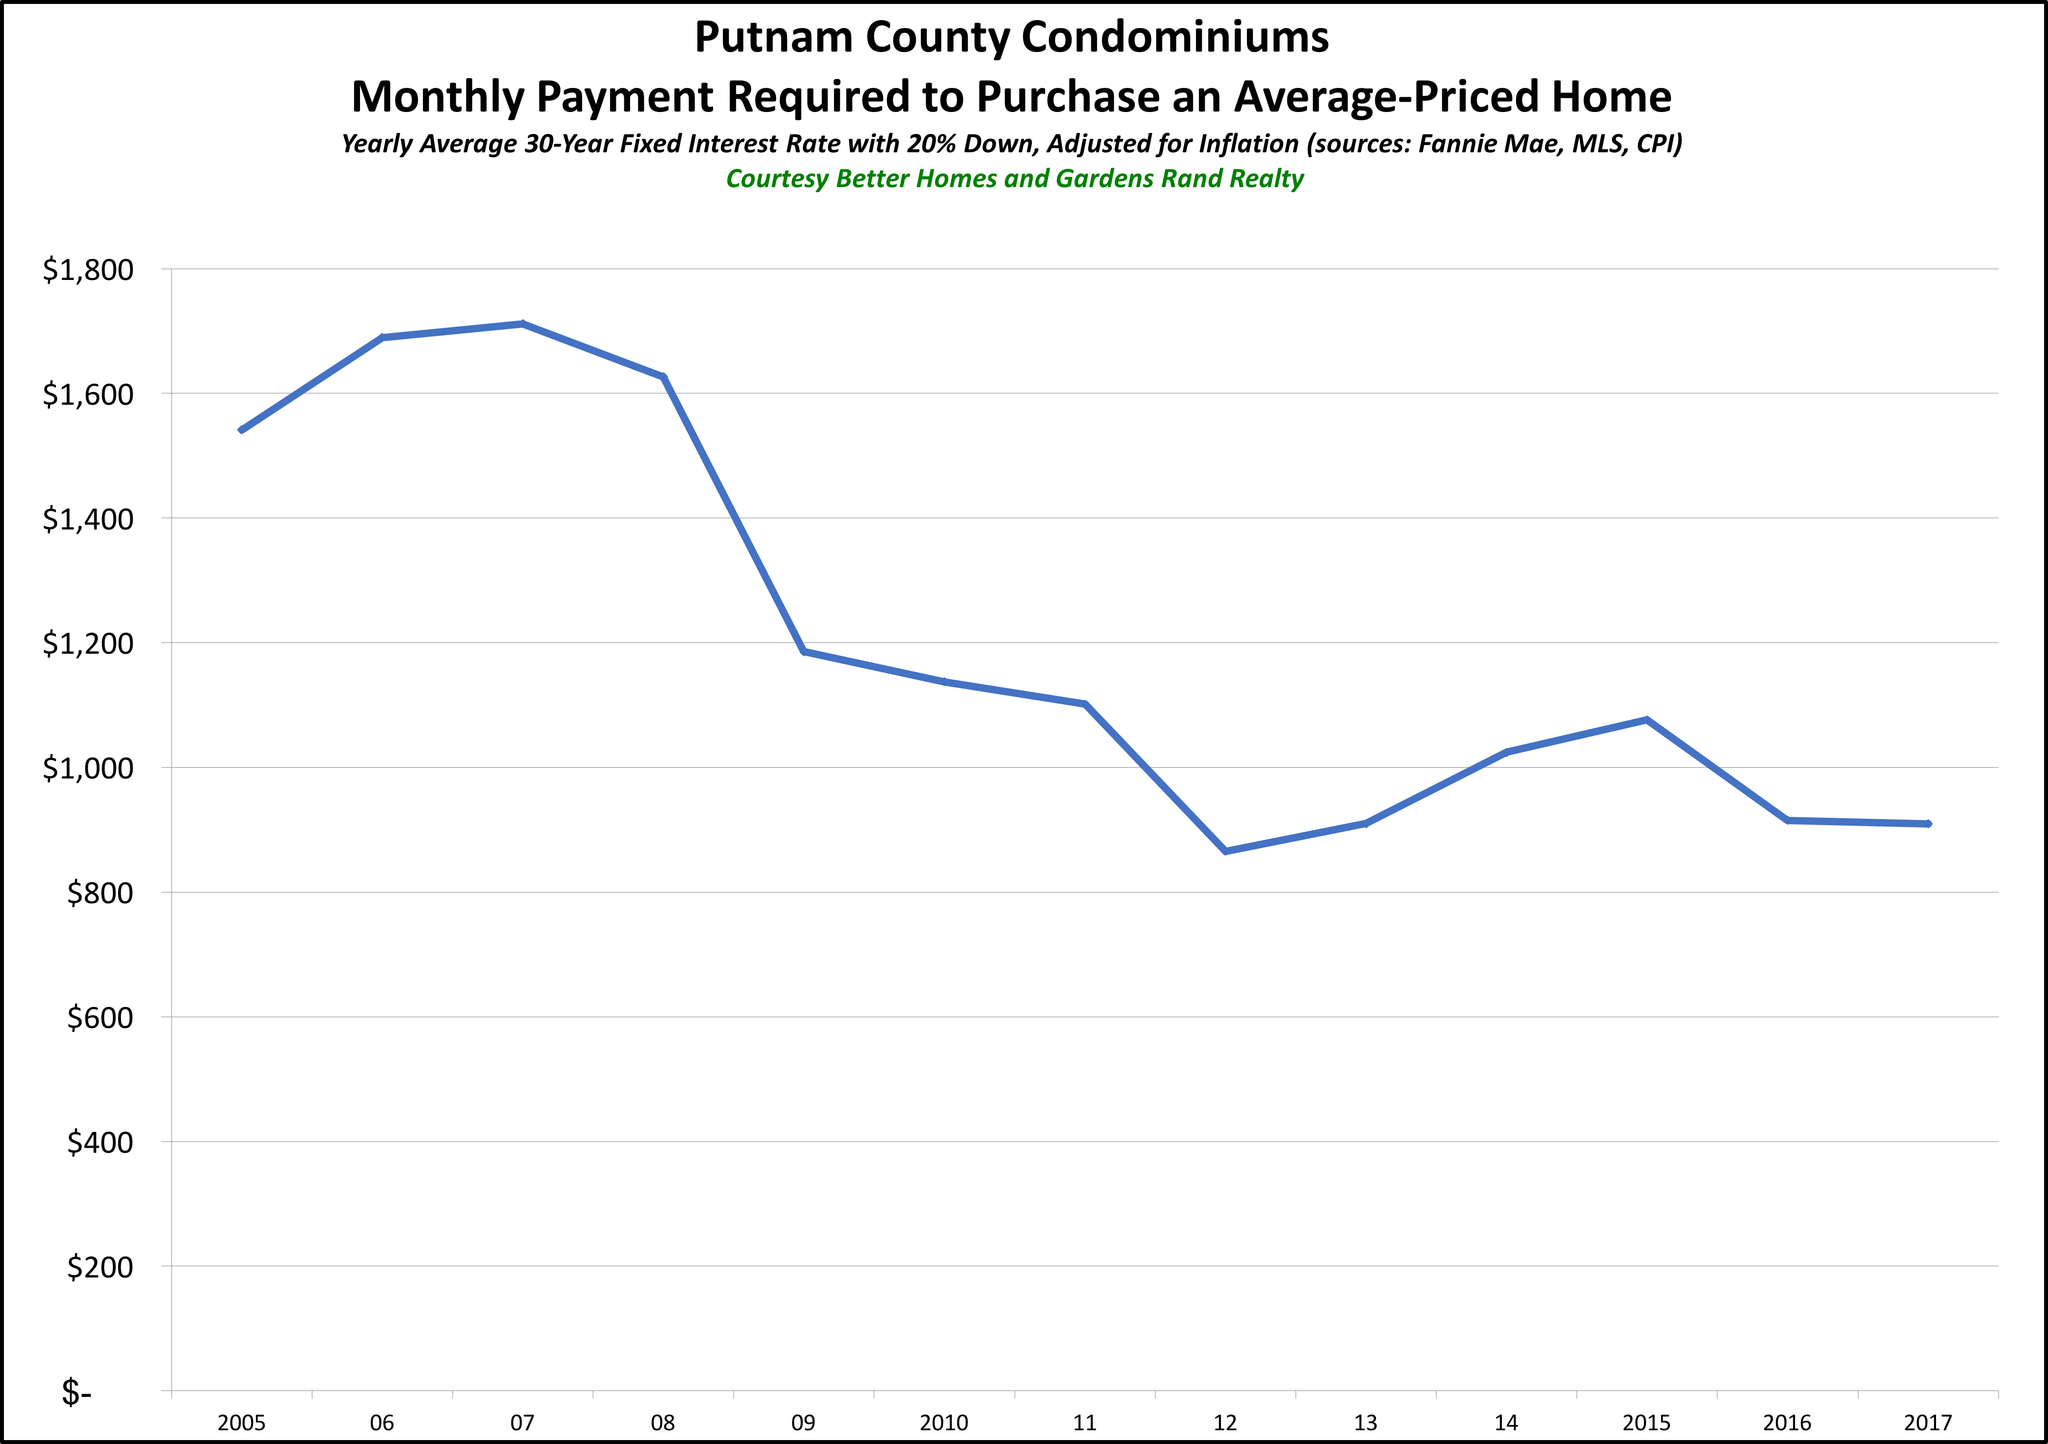
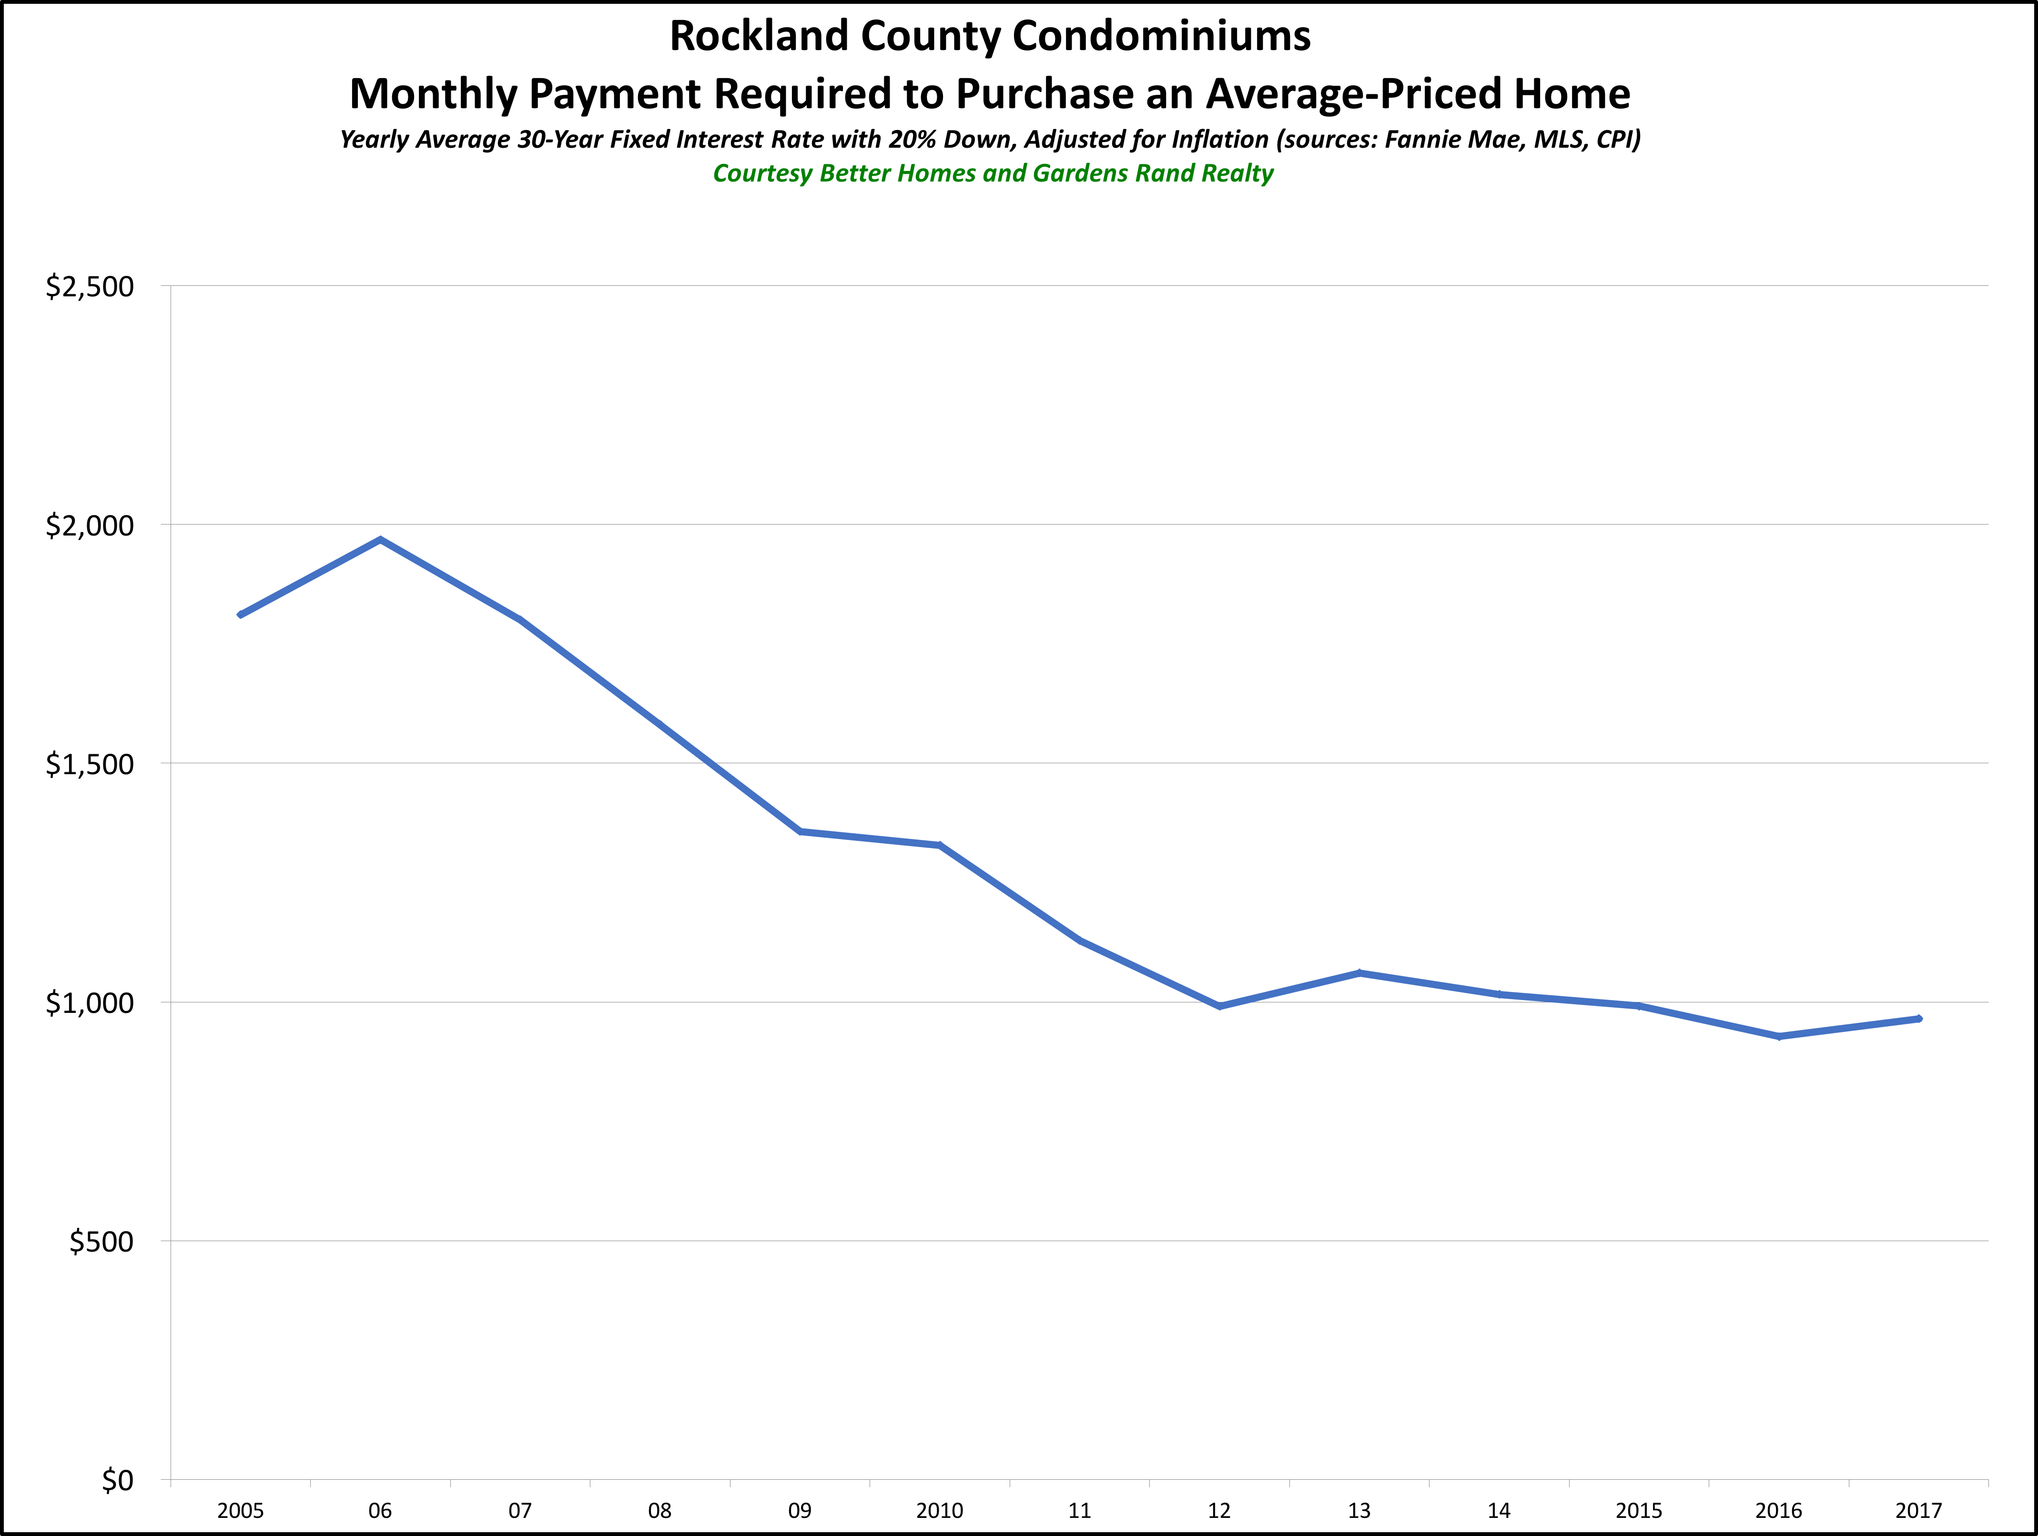
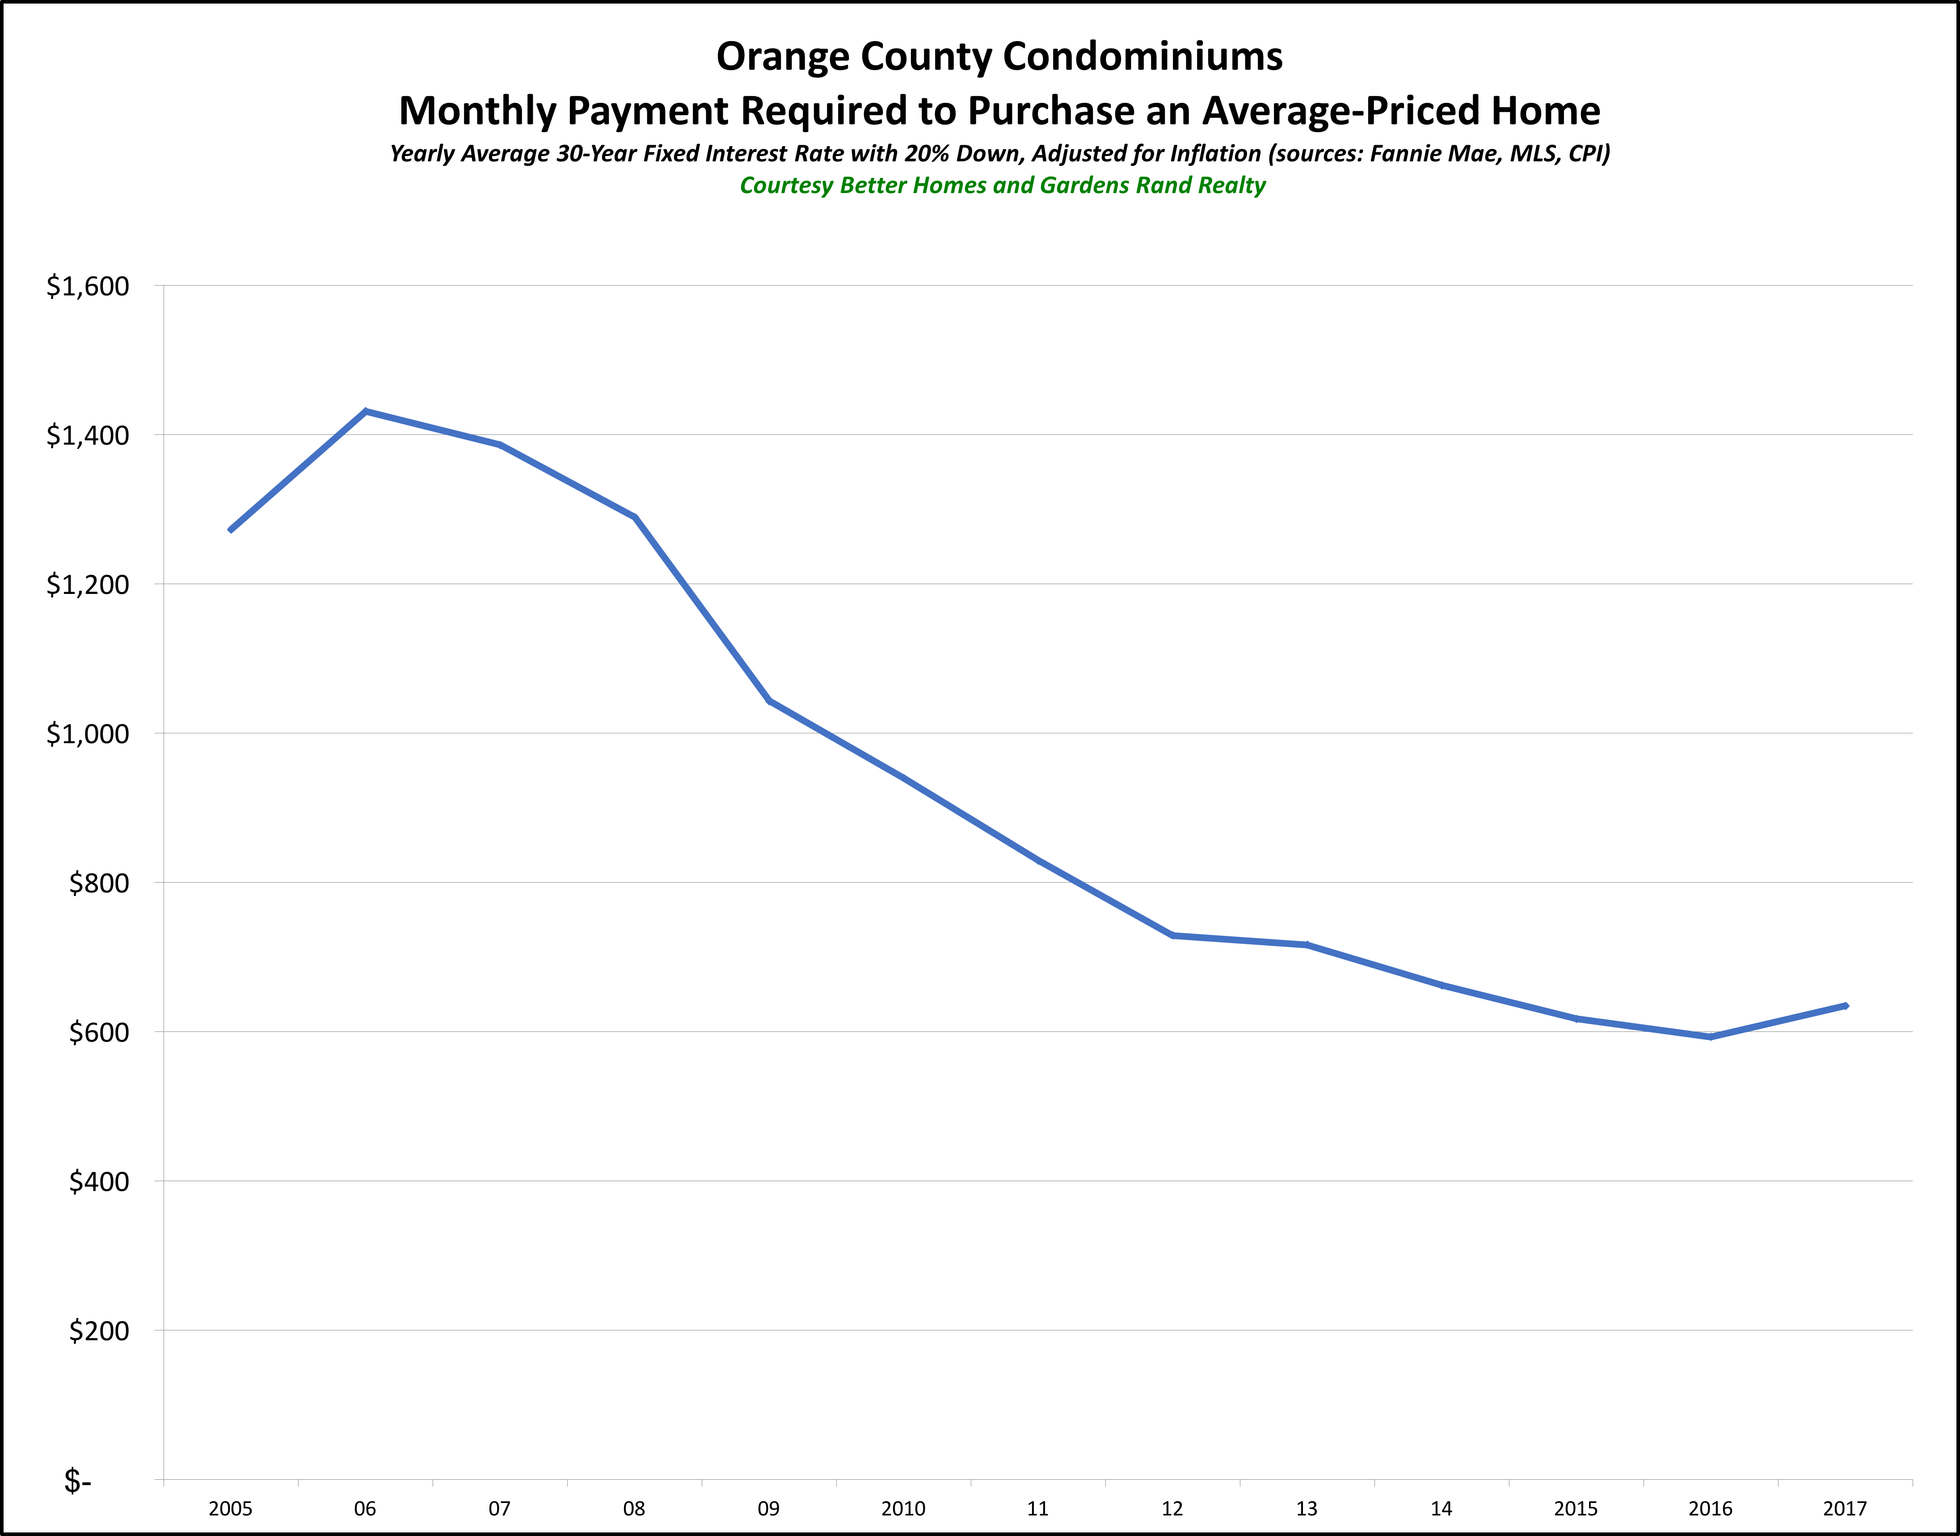
You can see that except for Westchester and Putnam condos, which have seen some pricing changes in the past two years, the monthly payments are lower than any time since 2005. And even in Westchester and Putnam, they’re lower now than at any time in the last decade, just a little higher than the last two years.
We wrote this up last year, and predicted that 2016 would be the last time we’d be able to say it. And we were mostly correct, since prices throughout the region went up a bit, and rates started to creep up. So it’s not quite right to say that 2018 is the best year to buy a home in a generation, since 2917 and 2916might have been better. But you have to otice the trend — the real monthly payment you have to make to buy the average-priced home in our region is lower than it’s been in years.
Conclusion
Again, I HATE it when real estate professionals say that “this is a great time to buy,” because at many times in our history that has been bad advice.
But if you measure a “great time to buy” by looking at the monthly payment you’ll have to make to buy a home, then we’re talking about as good a time to buy as any in the past decades. Prices have been flat for almost 10 years, and they’re down significantly if you factor in the effects of inflation. And interest rates are still as low as we’ve ever seen them. Unless we see some major shock to the economy, I think we’re looking at a near-decade of reasonable price appreciation coupled with increasing interest rates – both of which are going to drive that monthly payment up over the next few years.
So I’m not going to tell you what to do. That’s not my job. But if you’ve been thinking about buying a home, I think these graphs speak for themselves.
To learn more about Better Homes and Gardens Real Estate Rand Realty, visit their website and Facebook page, and make sure to “Like” their page. You can also follow them on Twitter.
Joe Rand is the Chief Creative Officer of Better Homes and Gardens Real Estate | Rand Realty, and compiles and writes the Rand Quarterly Market Report.
Homes in Westchester and the Hudson Valley are STILL Cheaper Than They Have Been in a Generation
Right now is a really great time to be buying a home in Westchester or the Hudson Valley.
Man, do I hate saying that. As I’ve explained before, I hate the phrase “great time to buy” for a couple of reasons.
First, people have different needs, and a market that’s great for one person might be terrible for another person.
Second, while markets tend to move together, we do see micro-markets (i.e., towns and villages) that defy larger trends. So while it might be a great time to buy in Village A, it might be not so great in Town B.
Third, and most importantly, though, “it’s a great time to buy!” just seems like a hack thing to say, the kind of thing that TERRIBLE real estate agents have said for generations to get unsuspecting and gullible people to buy an overpriced home. And I think that most people get suspicious when real estate agents talk like that.
So I understand if you’re skeptical. And that’s why I don’t want to just TELL you it’s a great time to buy, I want to SHOW you why it’s a great time to buy.
Specifically, I want to make this specific point: the monthly payment you need to buy an inflation-adjusted average priced home in Westchester and the Hudson Valley is as low as its been in a generation.
Think about what I’m saying for a second. I’m NOT saying that homes are cheaper than they’ve ever been. That’s not true. Depending on the year, homes have appreciated, and if you go back more than 15 years, they’ve appreciated pretty dramatically. I’m just saying that the MONTHLY PAYMENT you need to make to buy the AVERAGE PRICED HOME is lower right now than it’s been in a generation — if you control for the effects of inflation.
If you look at the graph below for Westchester County, you’ll see what I mean.

On that graph, as we’ve done before, we’ve plotted the monthly payment that a purchaser in the county would have to make to purchase the average-priced home at various points over the years. After all, affordability is not just a matter of the sales price – it’s a matter of the monthly payment you’re going to have to make, which is partly a function of the prevailing interest rate. And then to measure the change in the monthly payment over time, we factored in the effects of inflation.
So we took the following data points:
•The average price of a single family home up to the end of 2016 – from the local MLS data.
•The average interest rate for a 30-year fixed-rate mortgage for every calendar year up to 2016 – from Freddie Mac.
•The prevailing inflation rate for every calendar year up to 2016– from the US Department of Labor.
You can see the results on the graph. The monthly payment you have to make to purchase the average-priced home in Westchester is just about as low as it’s been in years. We saw the slightest uptick from 2012-2014, partially because of a slight increase in pricing and a slow inflating of interest rates. But the payment came down again over the past two years, with rates falling and prices stalling.
Generally, though, we’re talking about a monthly payment that is as low as anytime in the past 35 years – and as low as it was in the mid-1990s, during a crippling buyer’s market.
So why are monthly payments lower than they’ve been in a generation? A couple of reasons:
1) Prices. Part of it is that we have not seen prices go up in any measurable way in almost 10 years. Home prices peaked in 2006-08, lost about 25-30% of value from 2008-2010, and have bounced around a little since then. But they’re still around 2004 levels — without controlling for inflation.
2) Inflation. Ah, yes, inflation — the value of money goes down a little bit each year as inflation takes a bite. Now, inflation rates have been pretty low over the past 15 years from historical standards, but that little bit each year does add up.
3) Rates. But the biggest reason we’re seeing monthly payments lower than they’ve been in a generation is that rates are still at historic lows. After all, about ten years ago, the average interest rate was about 6%. For the past few years, it’s been below 4%. That’s a huge difference in your monthly payment.
And the same is true throughout the Hudson Valley. I showed you Westchester first because we have good data on prices for the county going back all the way to 1981. In other counties, our data doesn’t go back as far, but if we look at each of those counties you can see that it’s pretty much the same story for the time period we have.
Orange County. Here’s Orange County, where we have data going back to 1994:
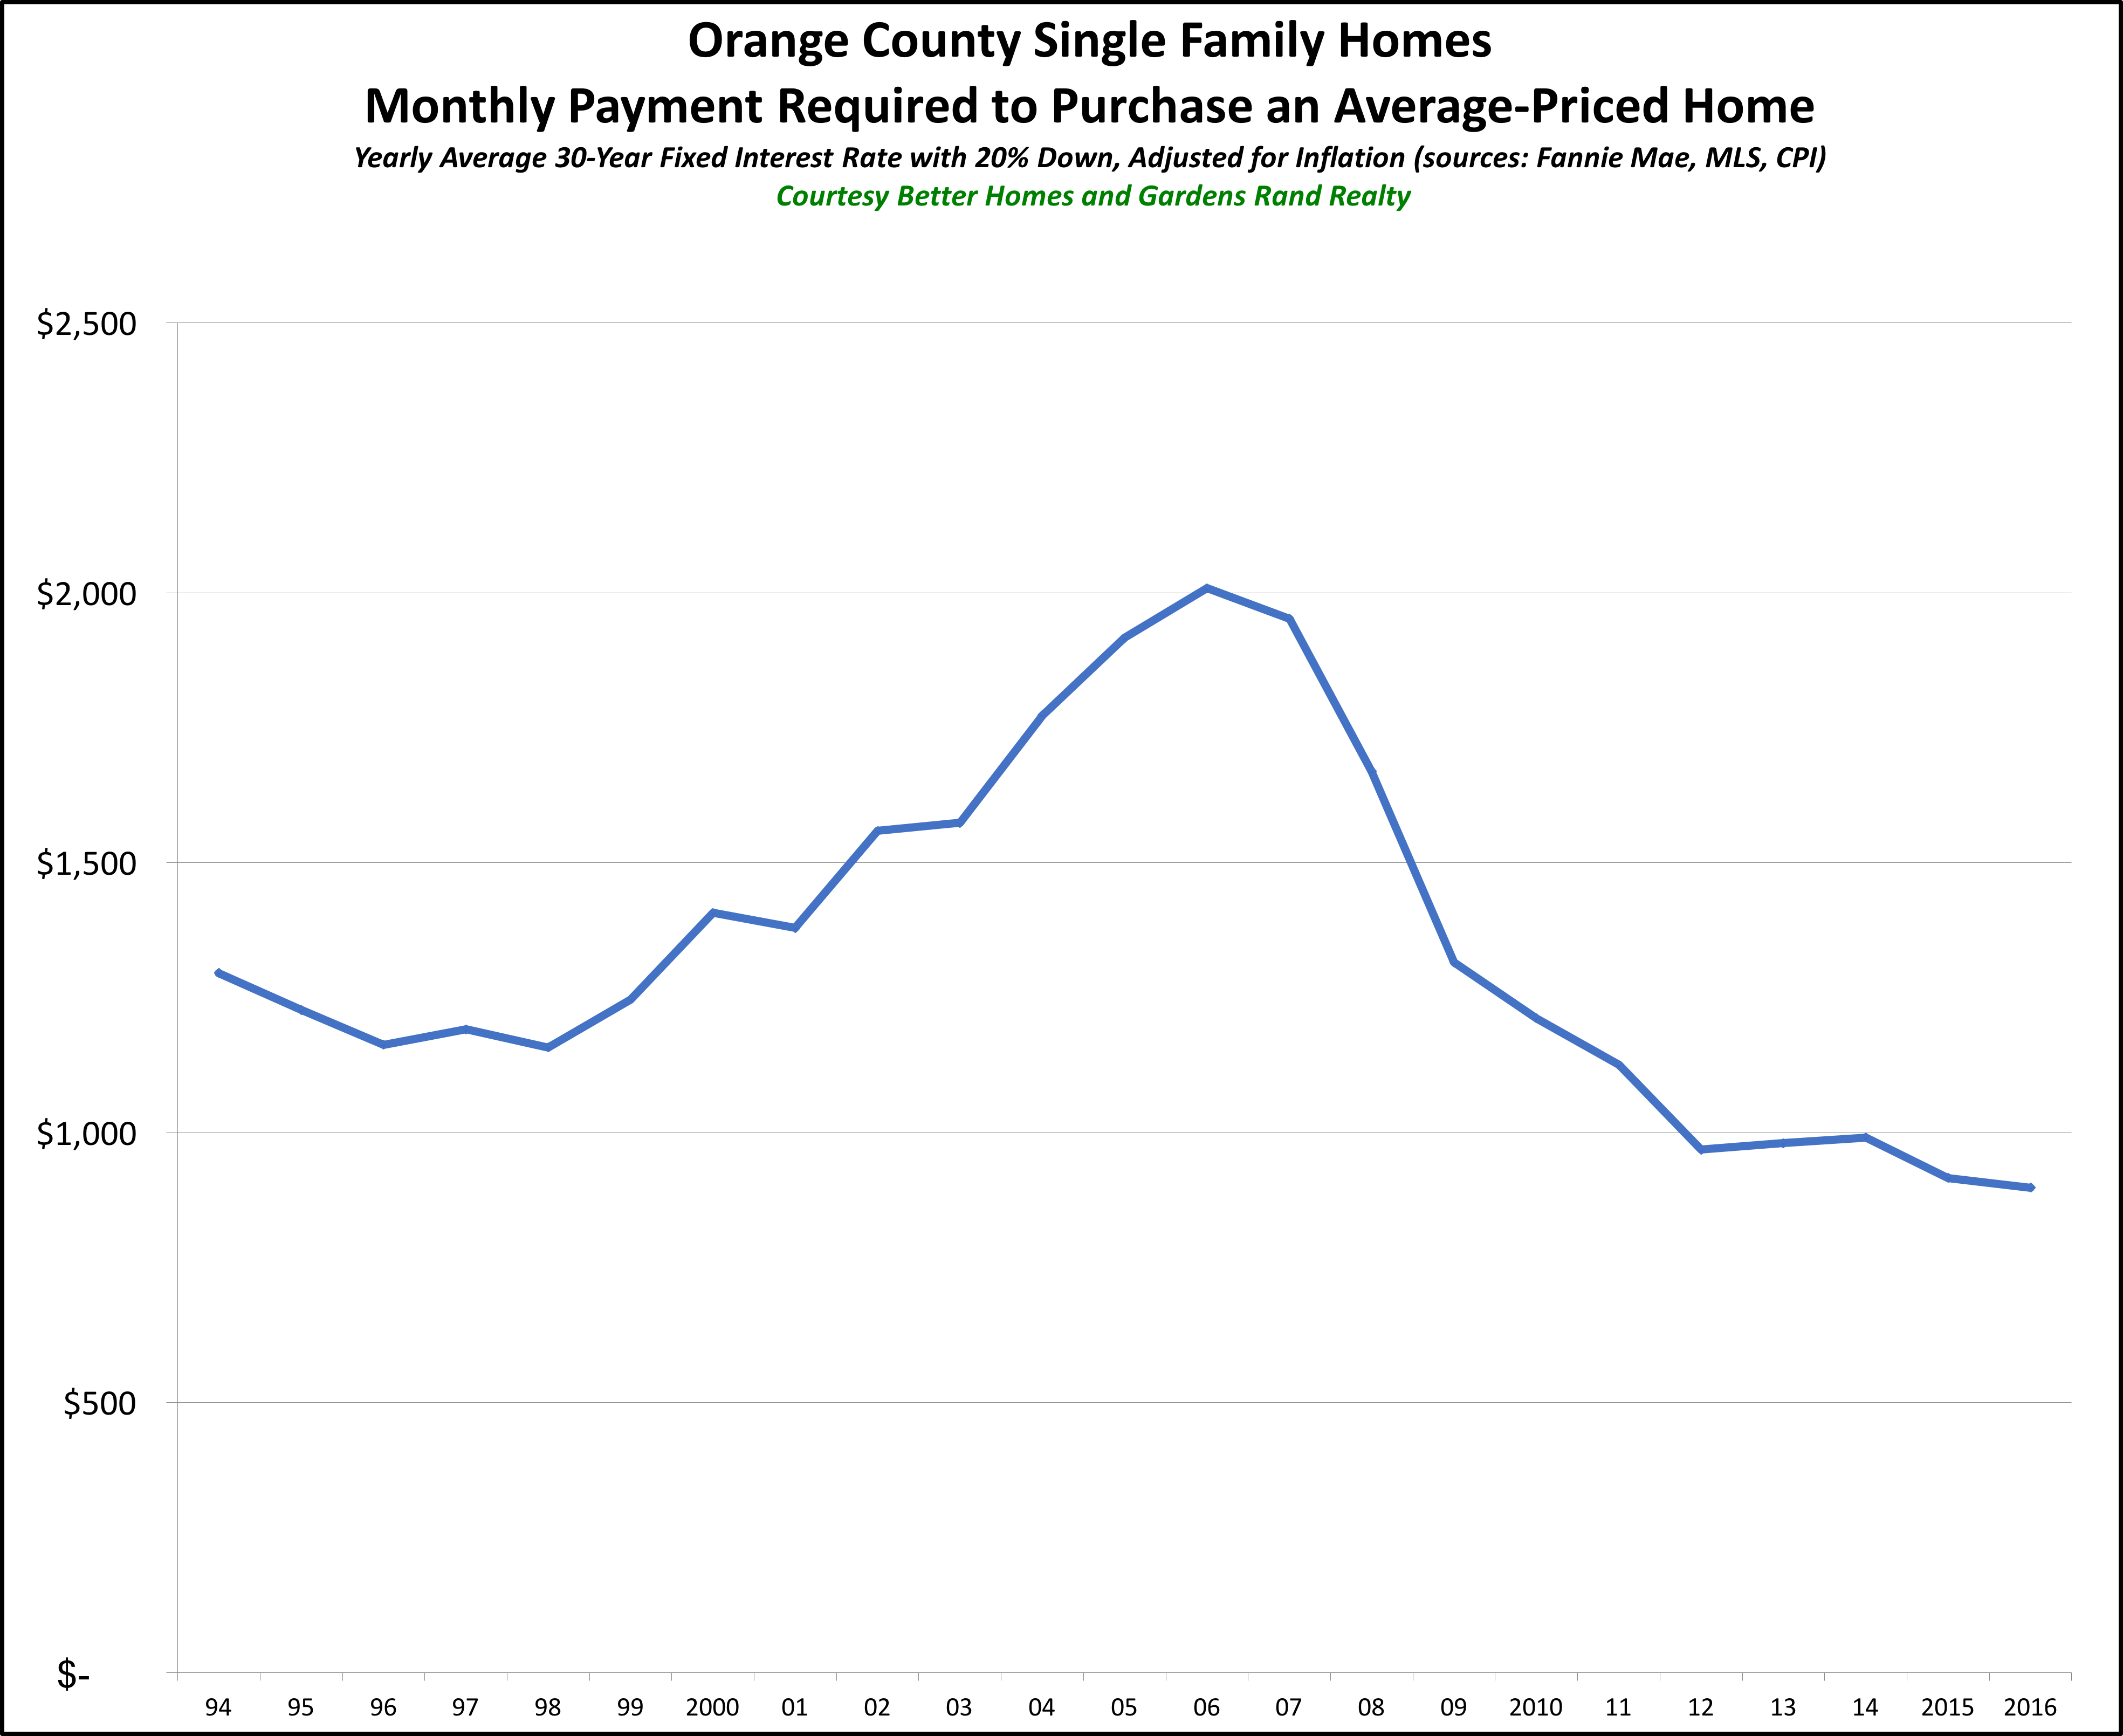
You can see that the monthly payment to buy an average-priced home in Orange County is lower right now than it’s been in over 20 years.
Rockland County. In Rockland, we have data going back to 2002, over 14 years of data.
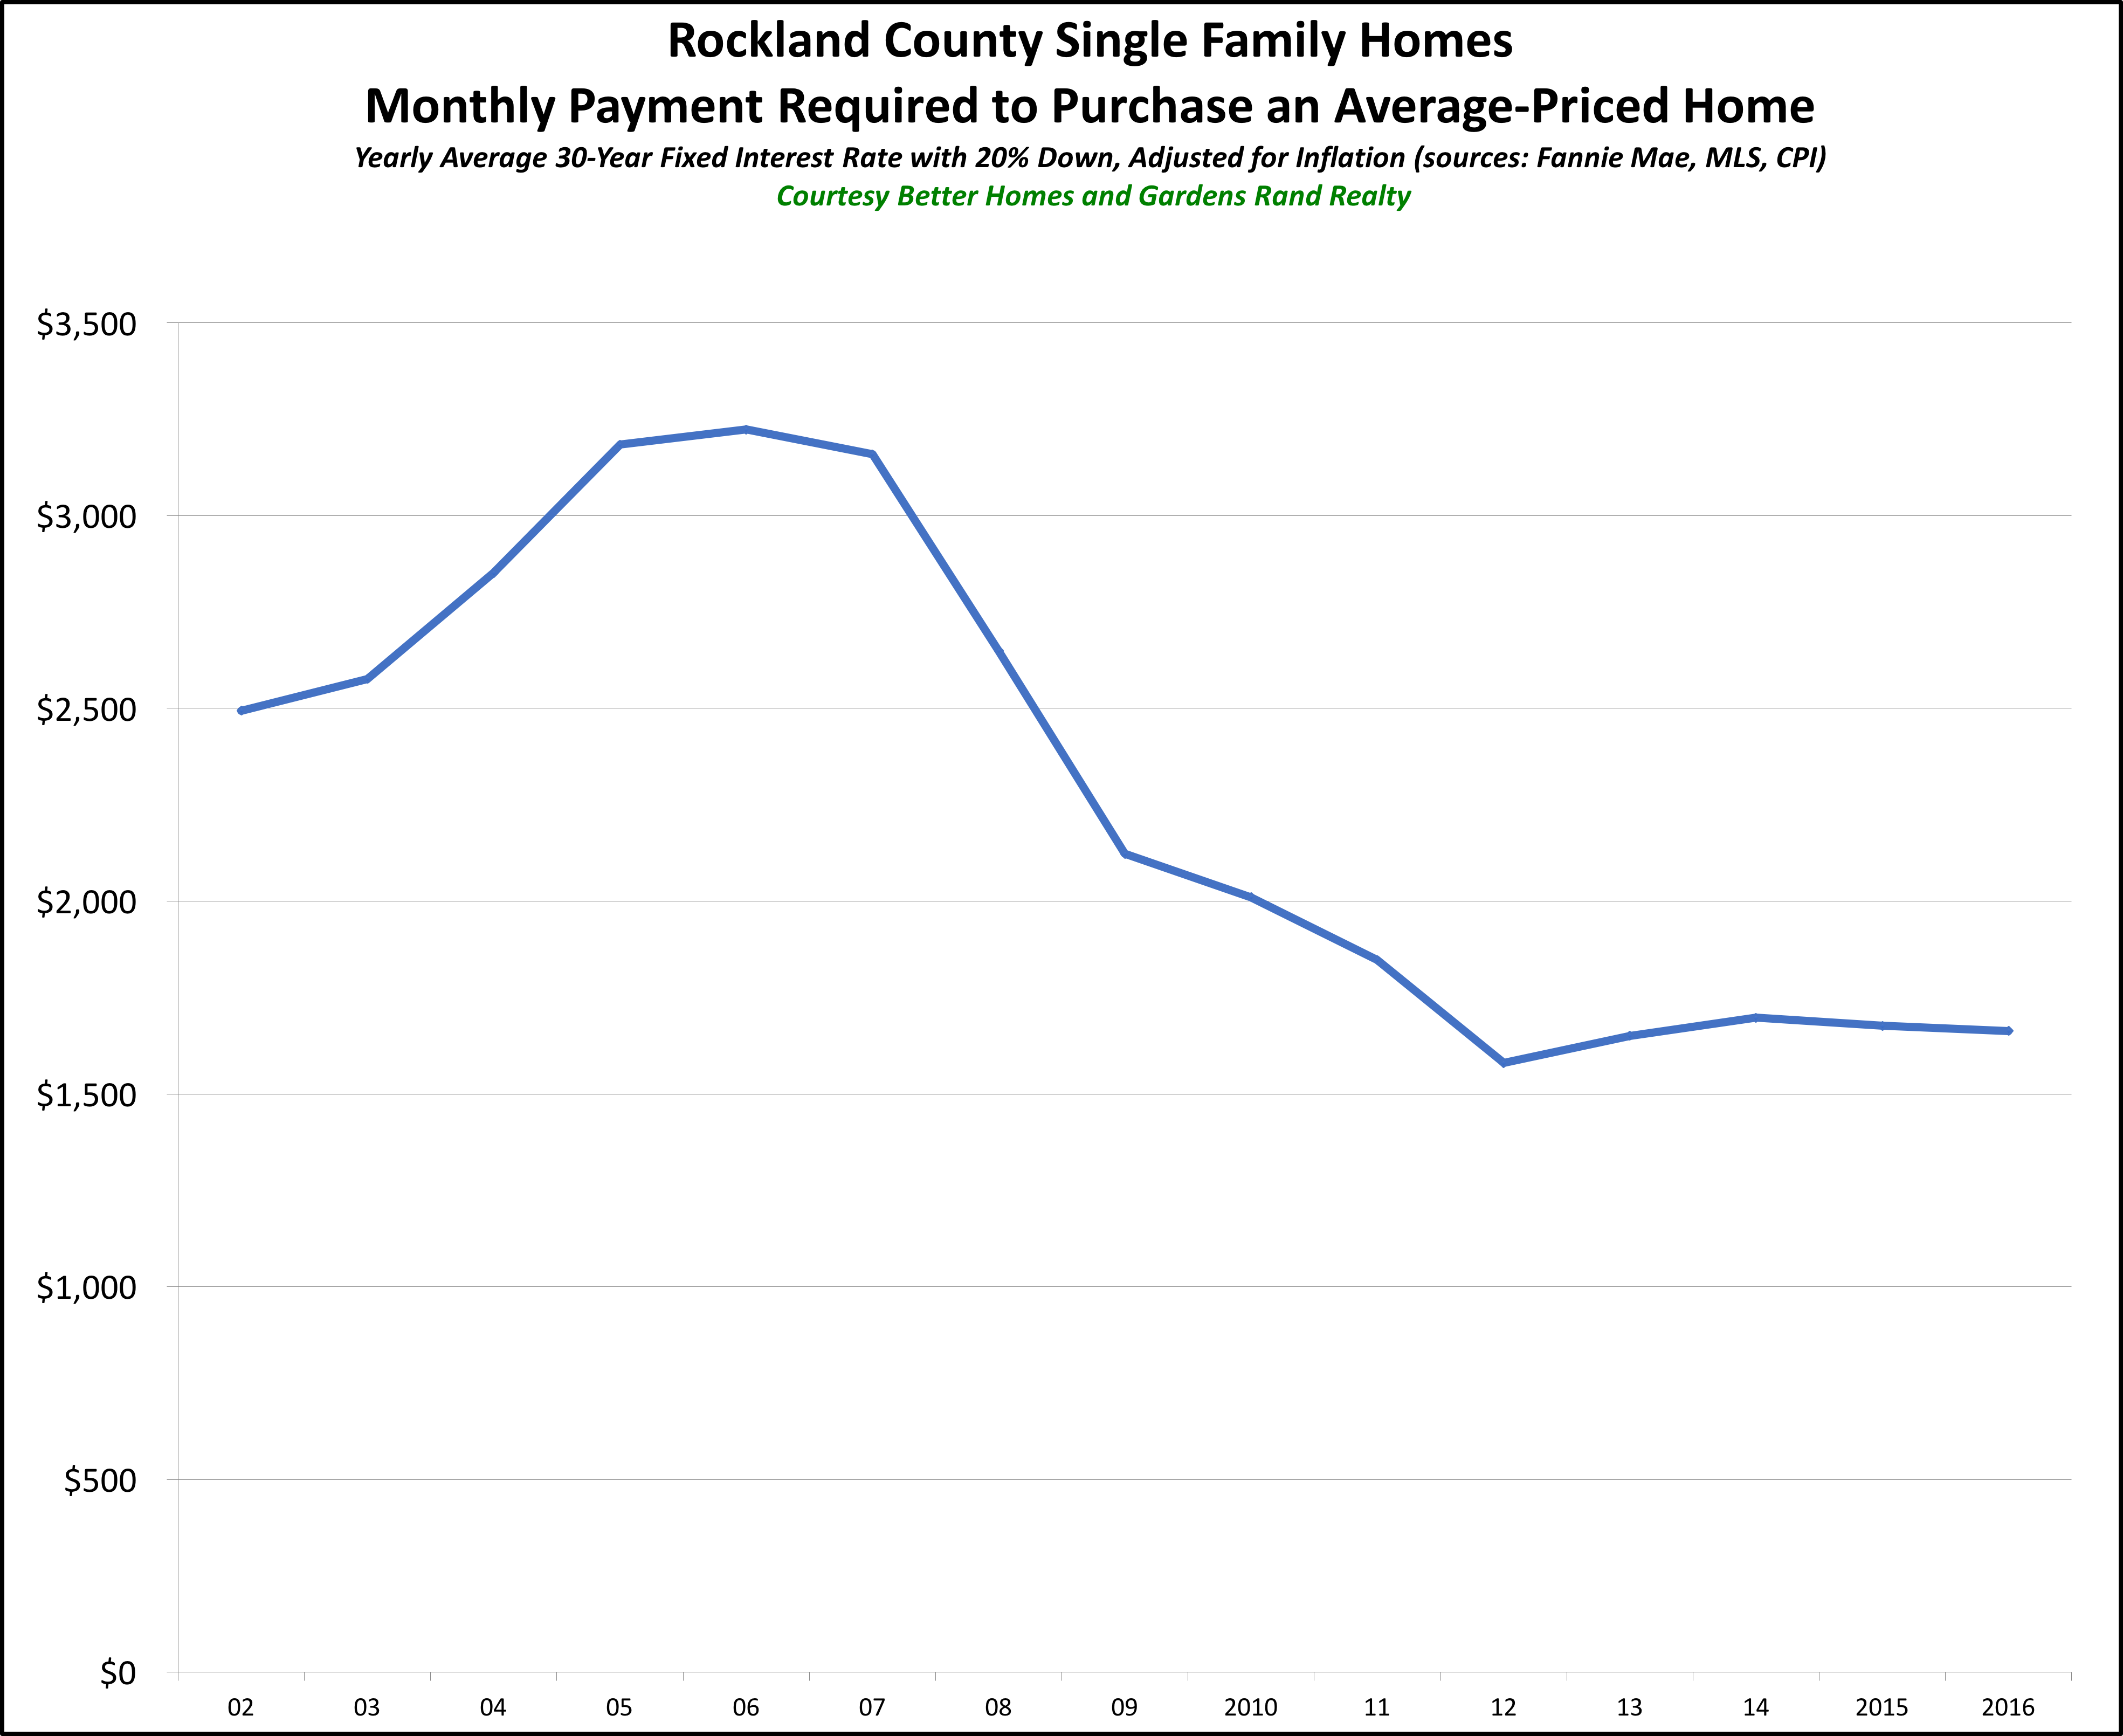
Again, you can see that even with a slight rise in the past few years, the monthly payment you have to make to buy the average-priced home in Rockland is lower right now than it’s been since at least 2002, and probably for quite a bit of time before that.
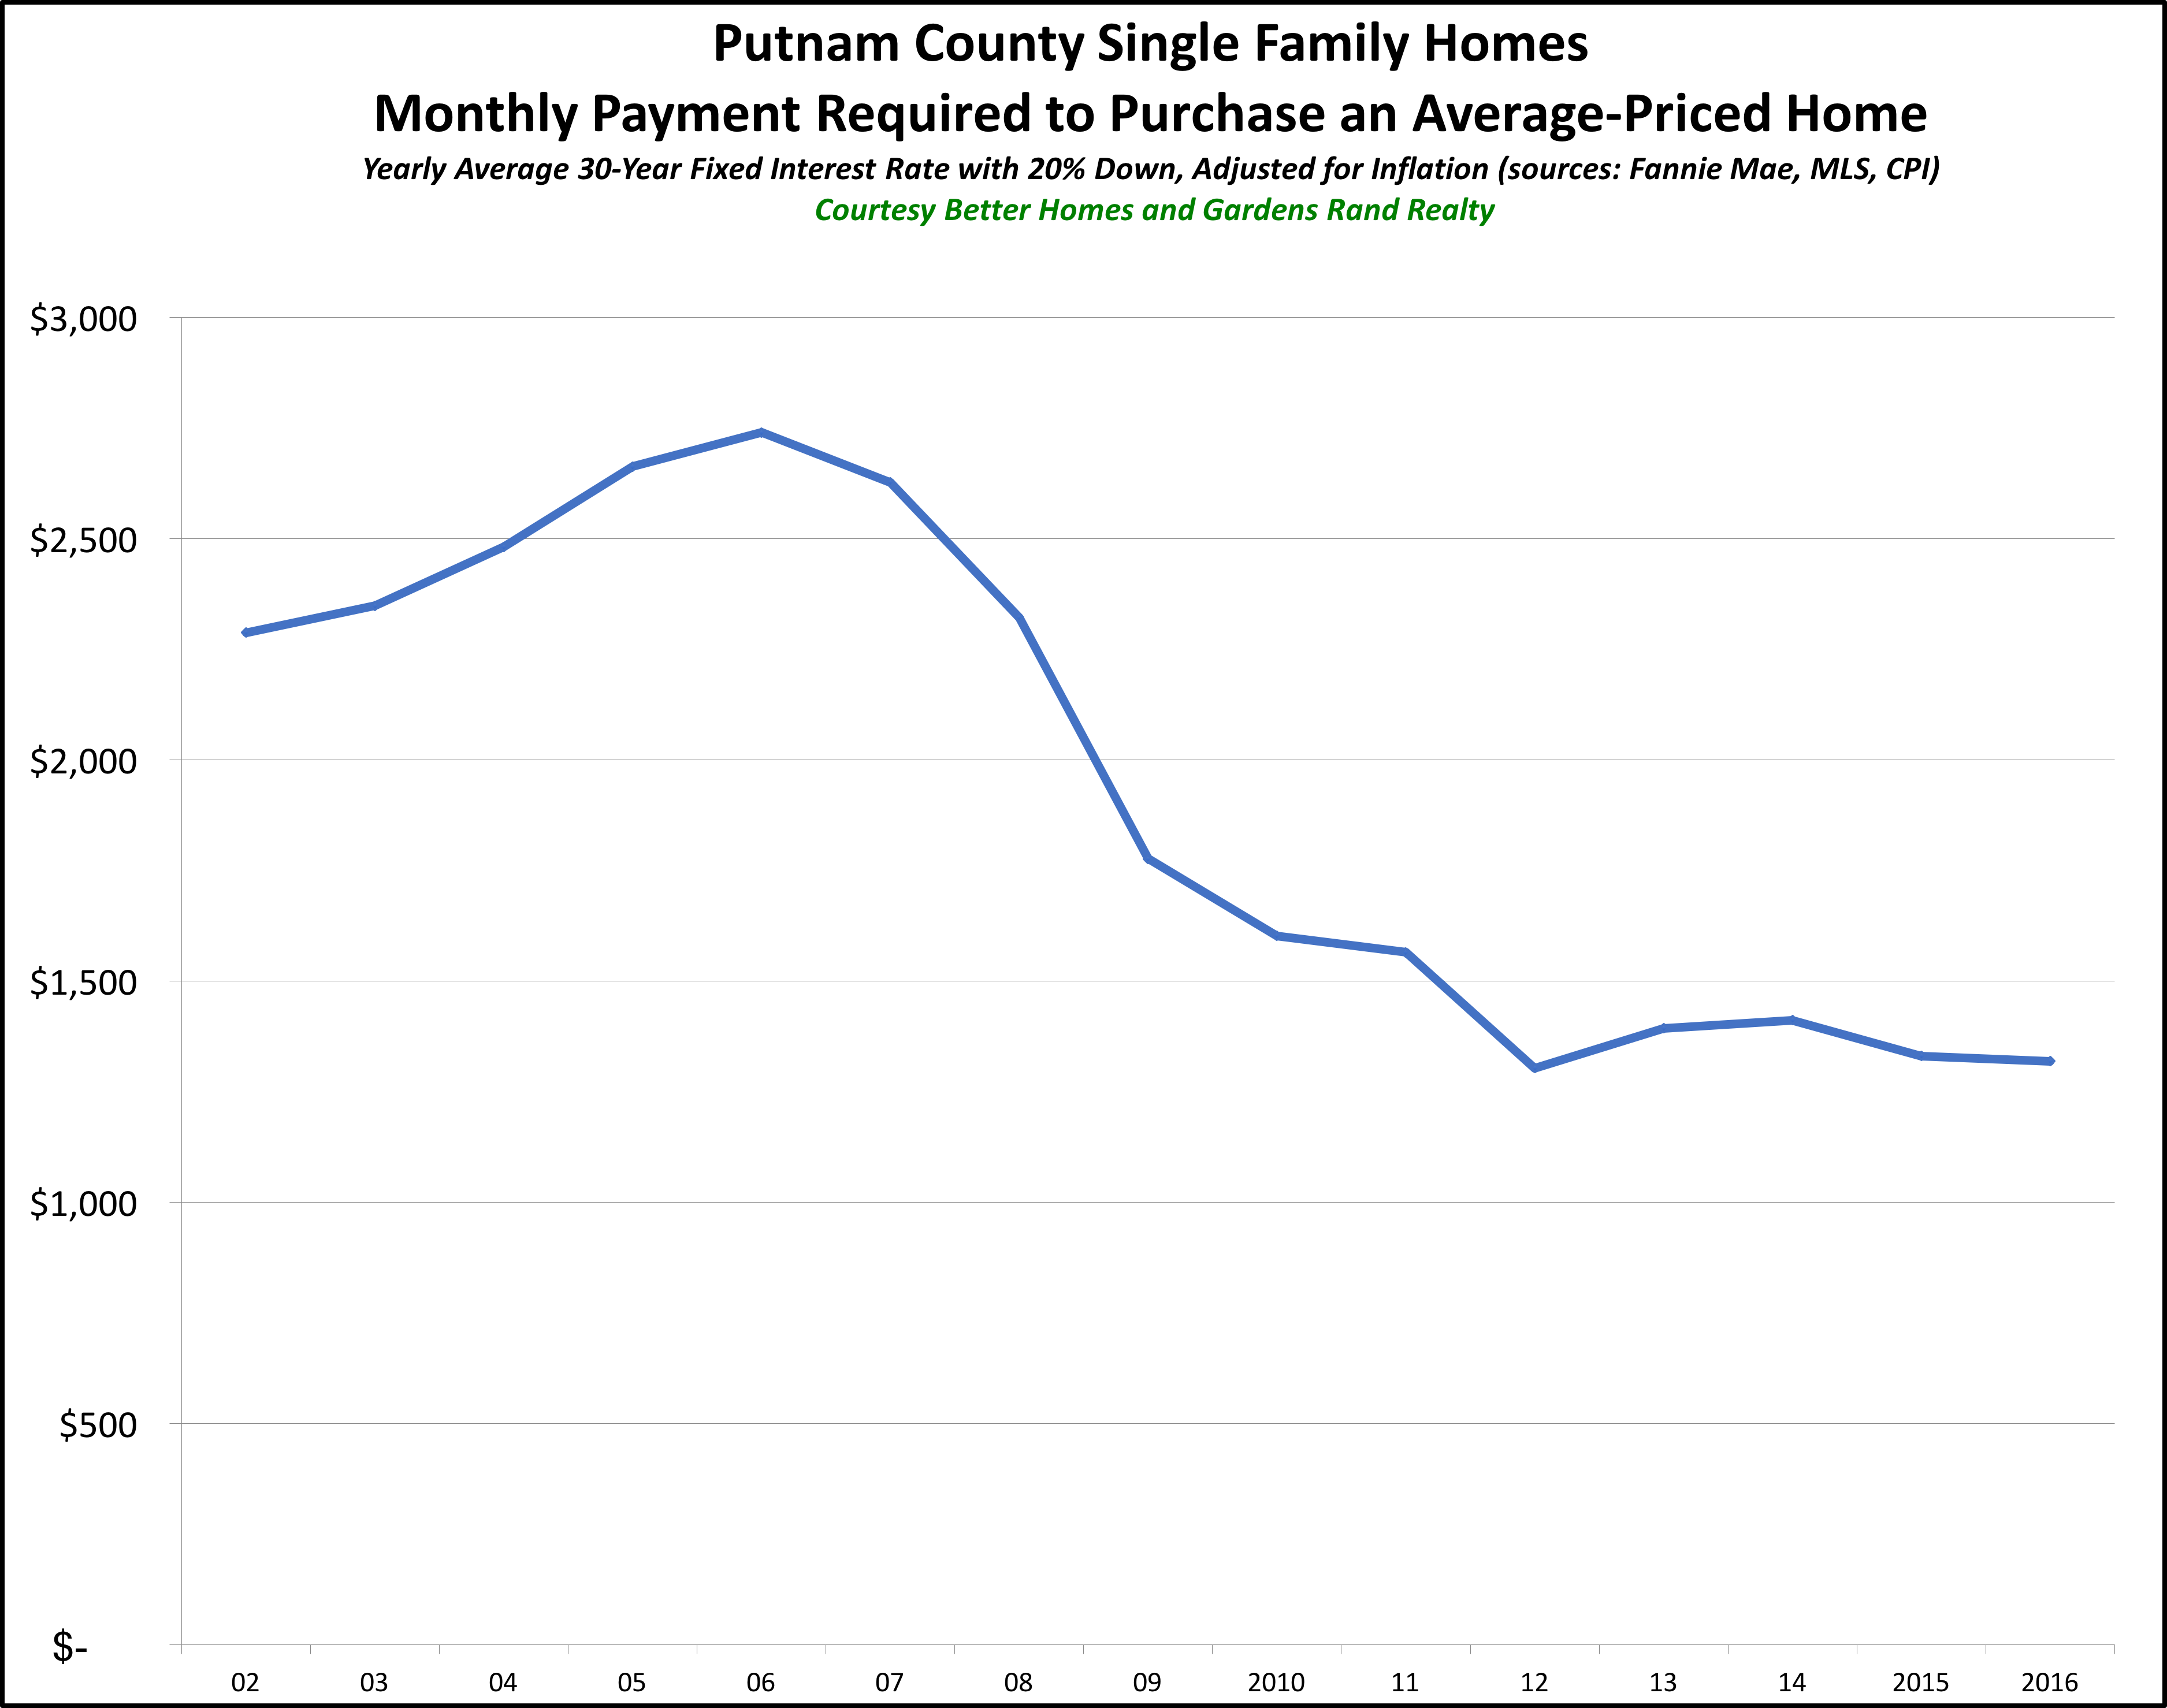
Putnam County. Similarly, we have data going back to 2002 in Putnam, and the story is the same:
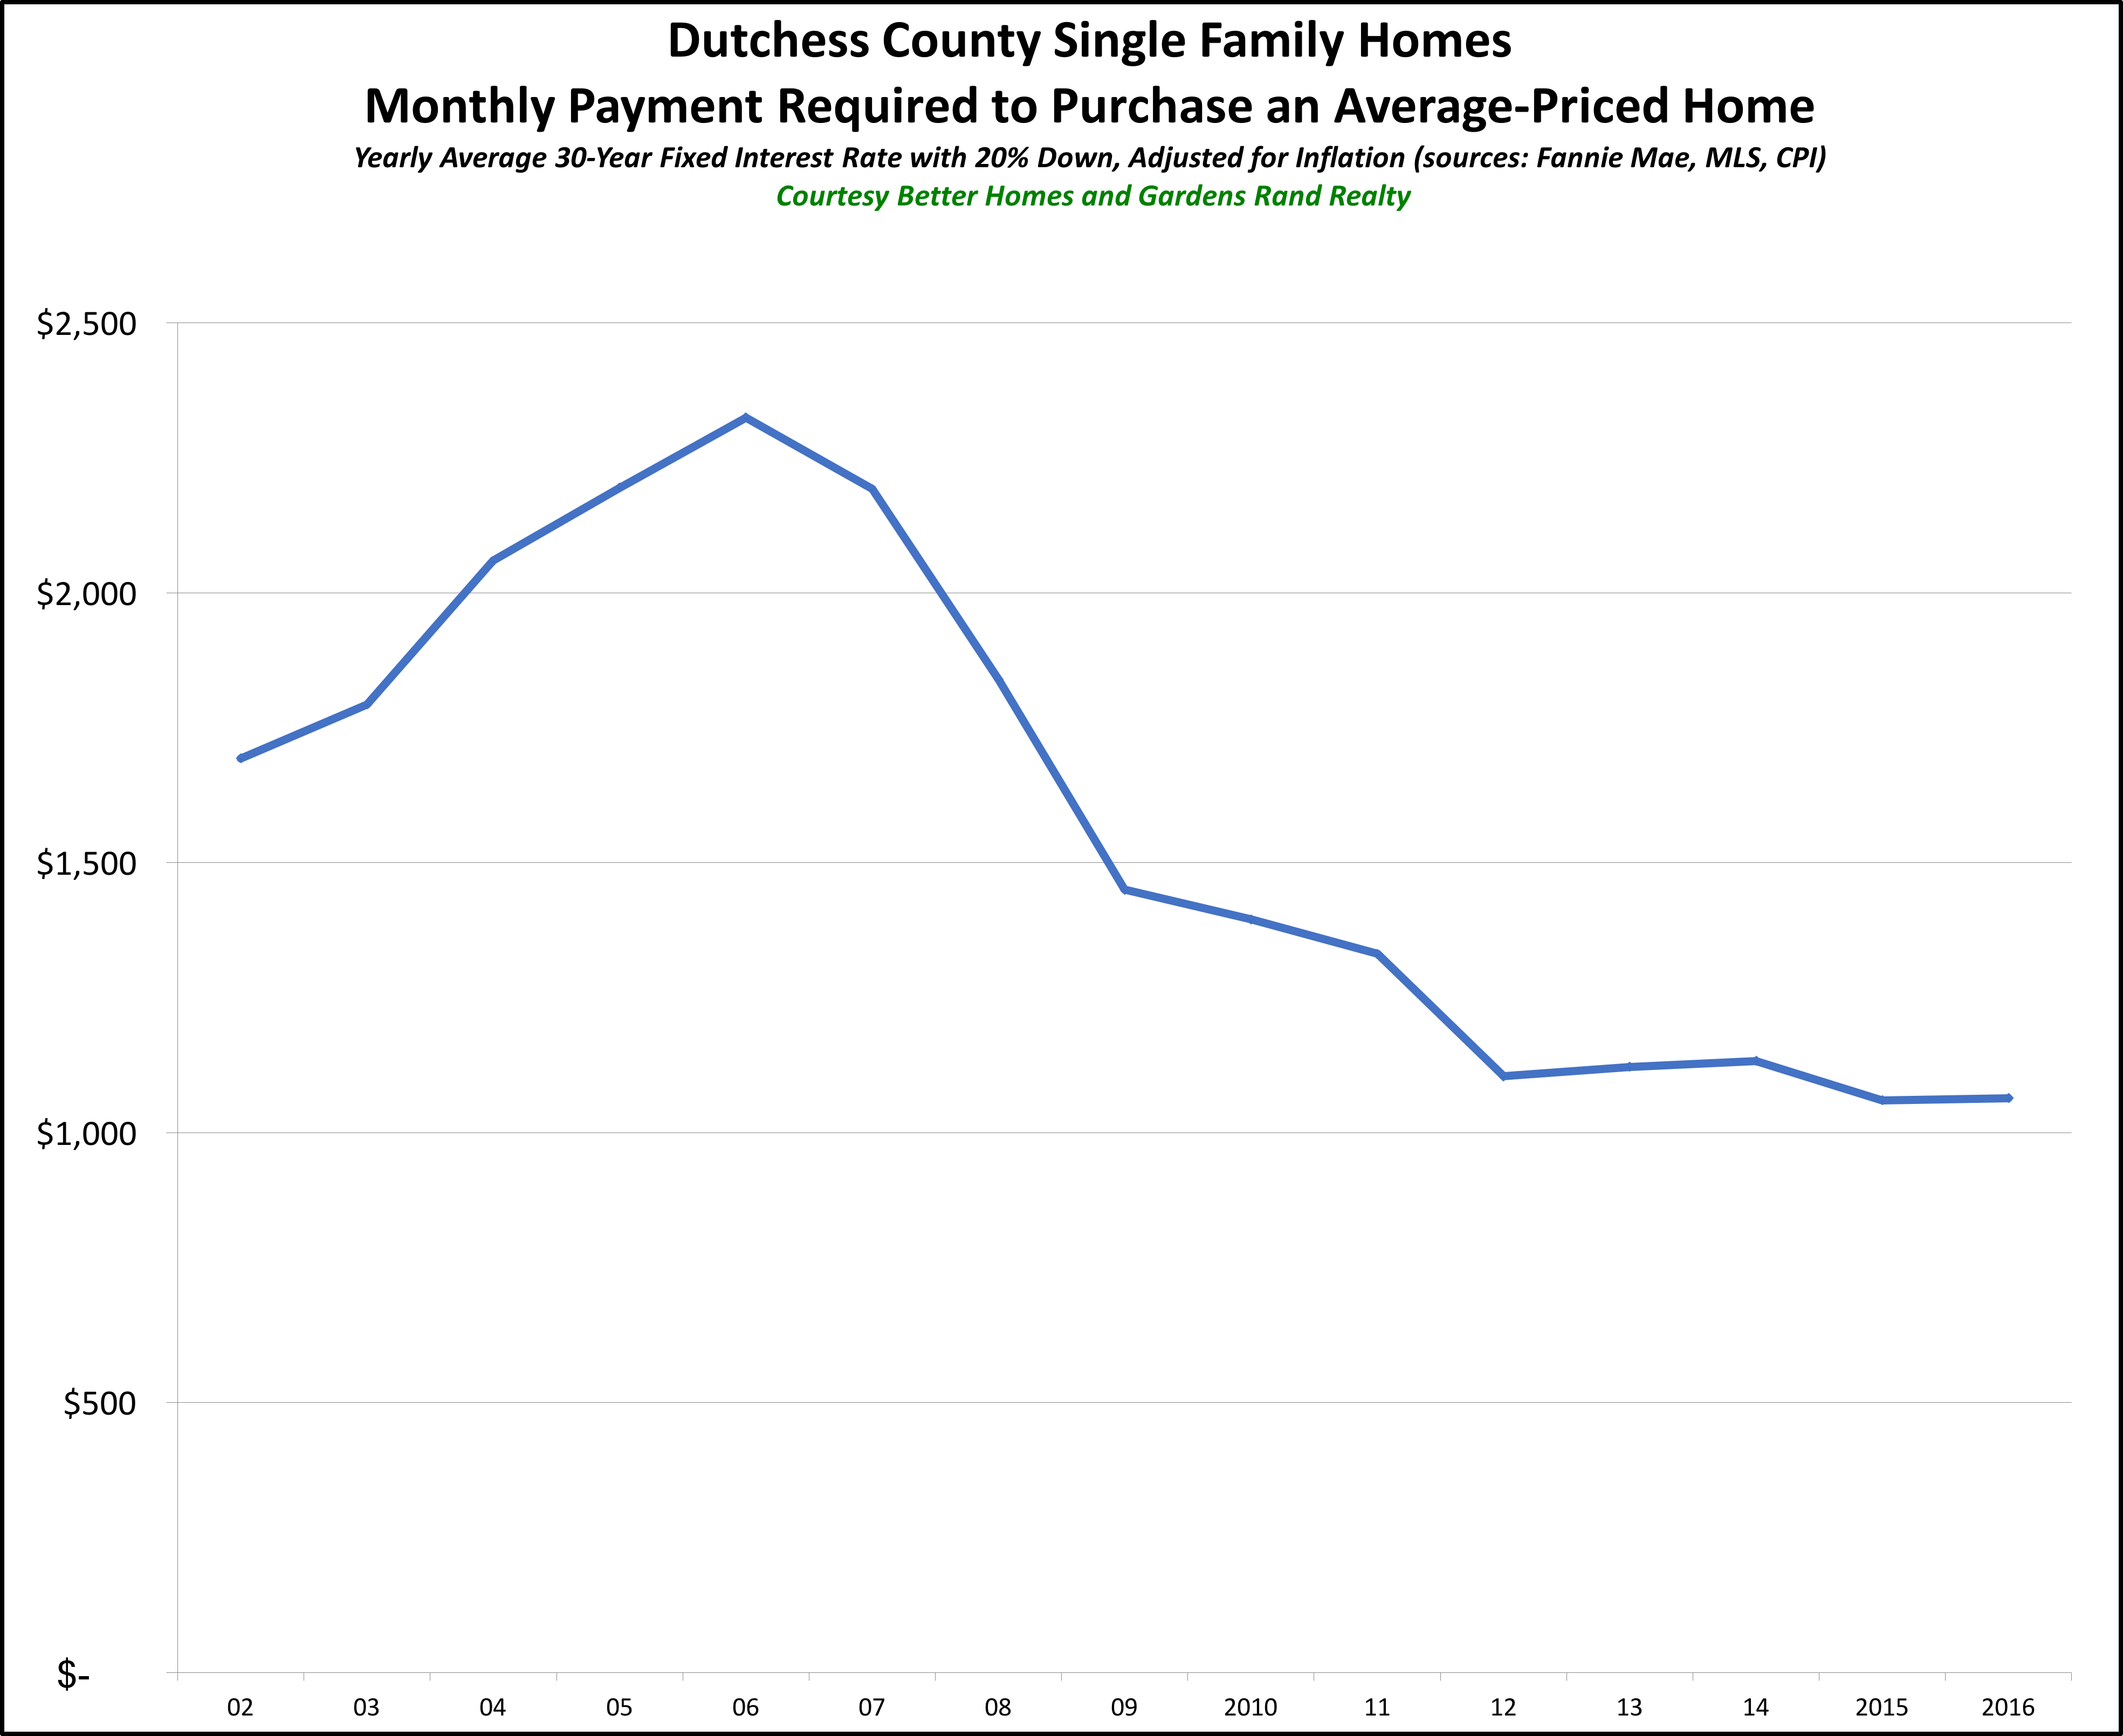
Dutchess County. Again, same story in Dutchess County for that same period:
And although we don’t have data for Orange, Rockland, Putnam, or Dutchess going back as far as Westchester, the fact that the curve over the recent decade or so is very consistent with Westchester’s results suggests that, like in Westchester, the monthly payment you need to make throughout the Hudson Valley is lower right now than it’s been since the Carter administration.
Condos and Coops. All that’s for single-family homes. What about condos and coops? Well, we don’t have data going back as far, but in each county, condos (and coops in Westchester) show the same trend — the monthly payment to buy an average priced condo or coop in the region is lower right now than it’s been at any time since the 2005 era. Here are the graphs:
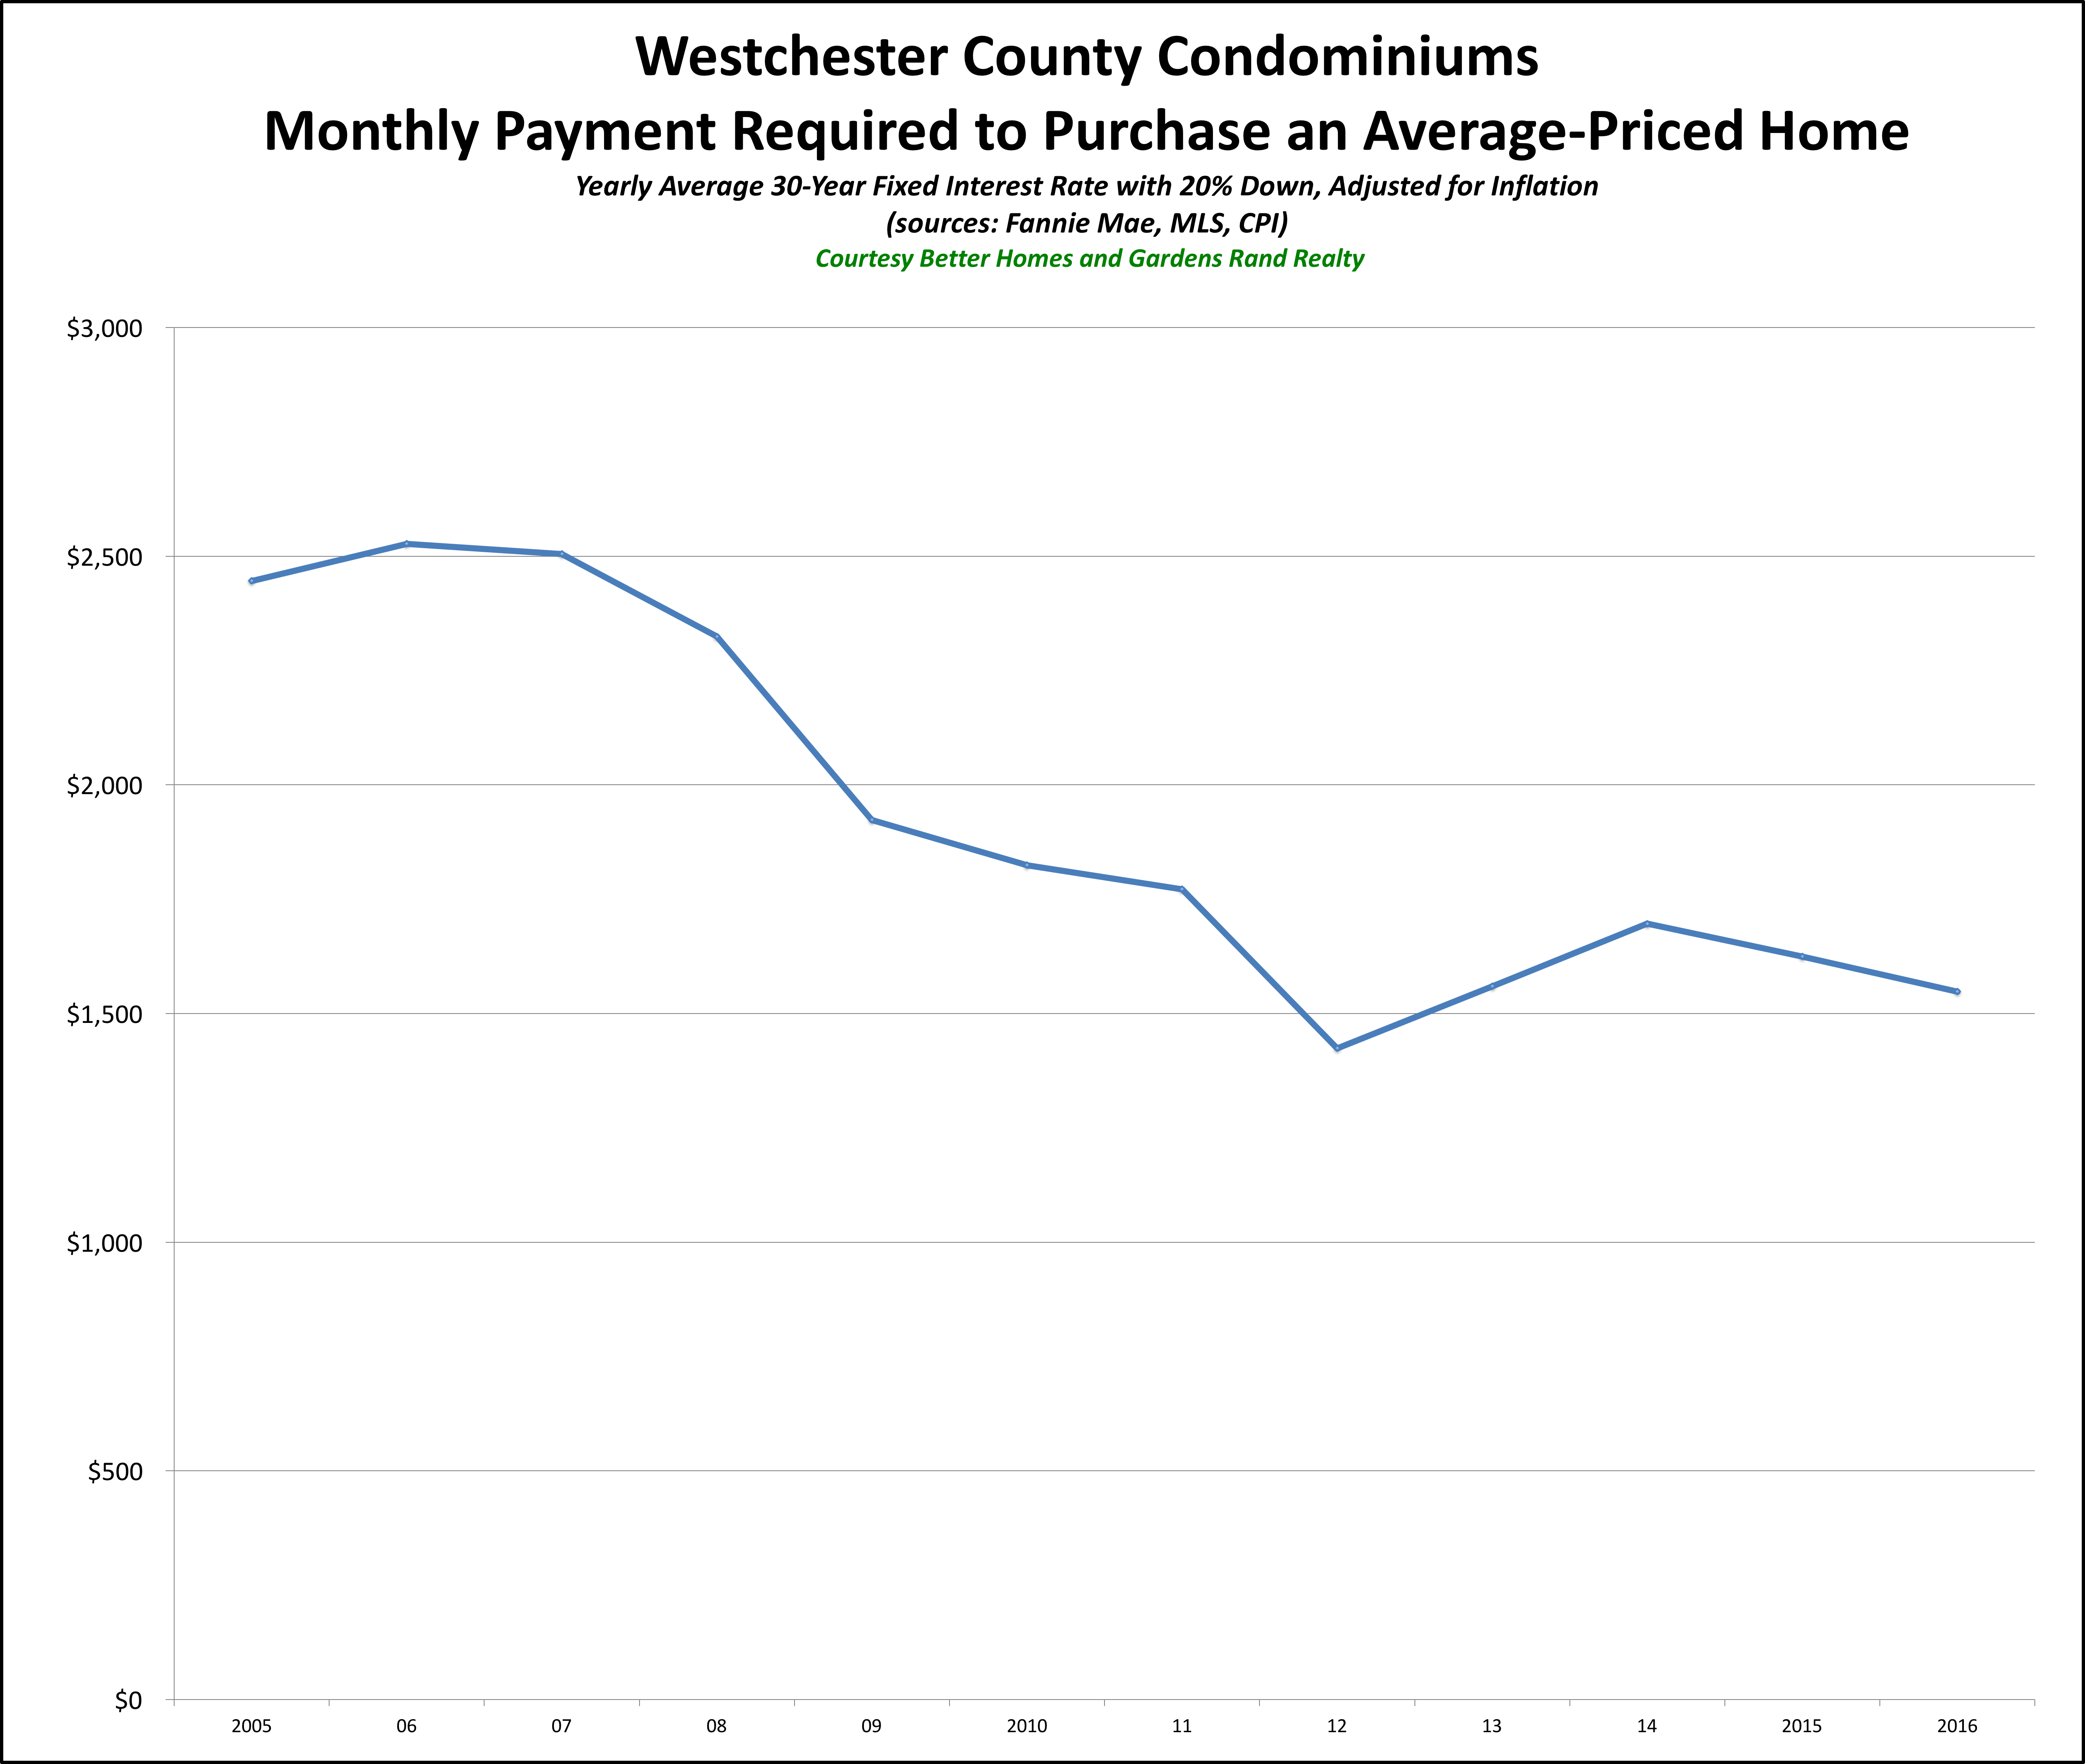
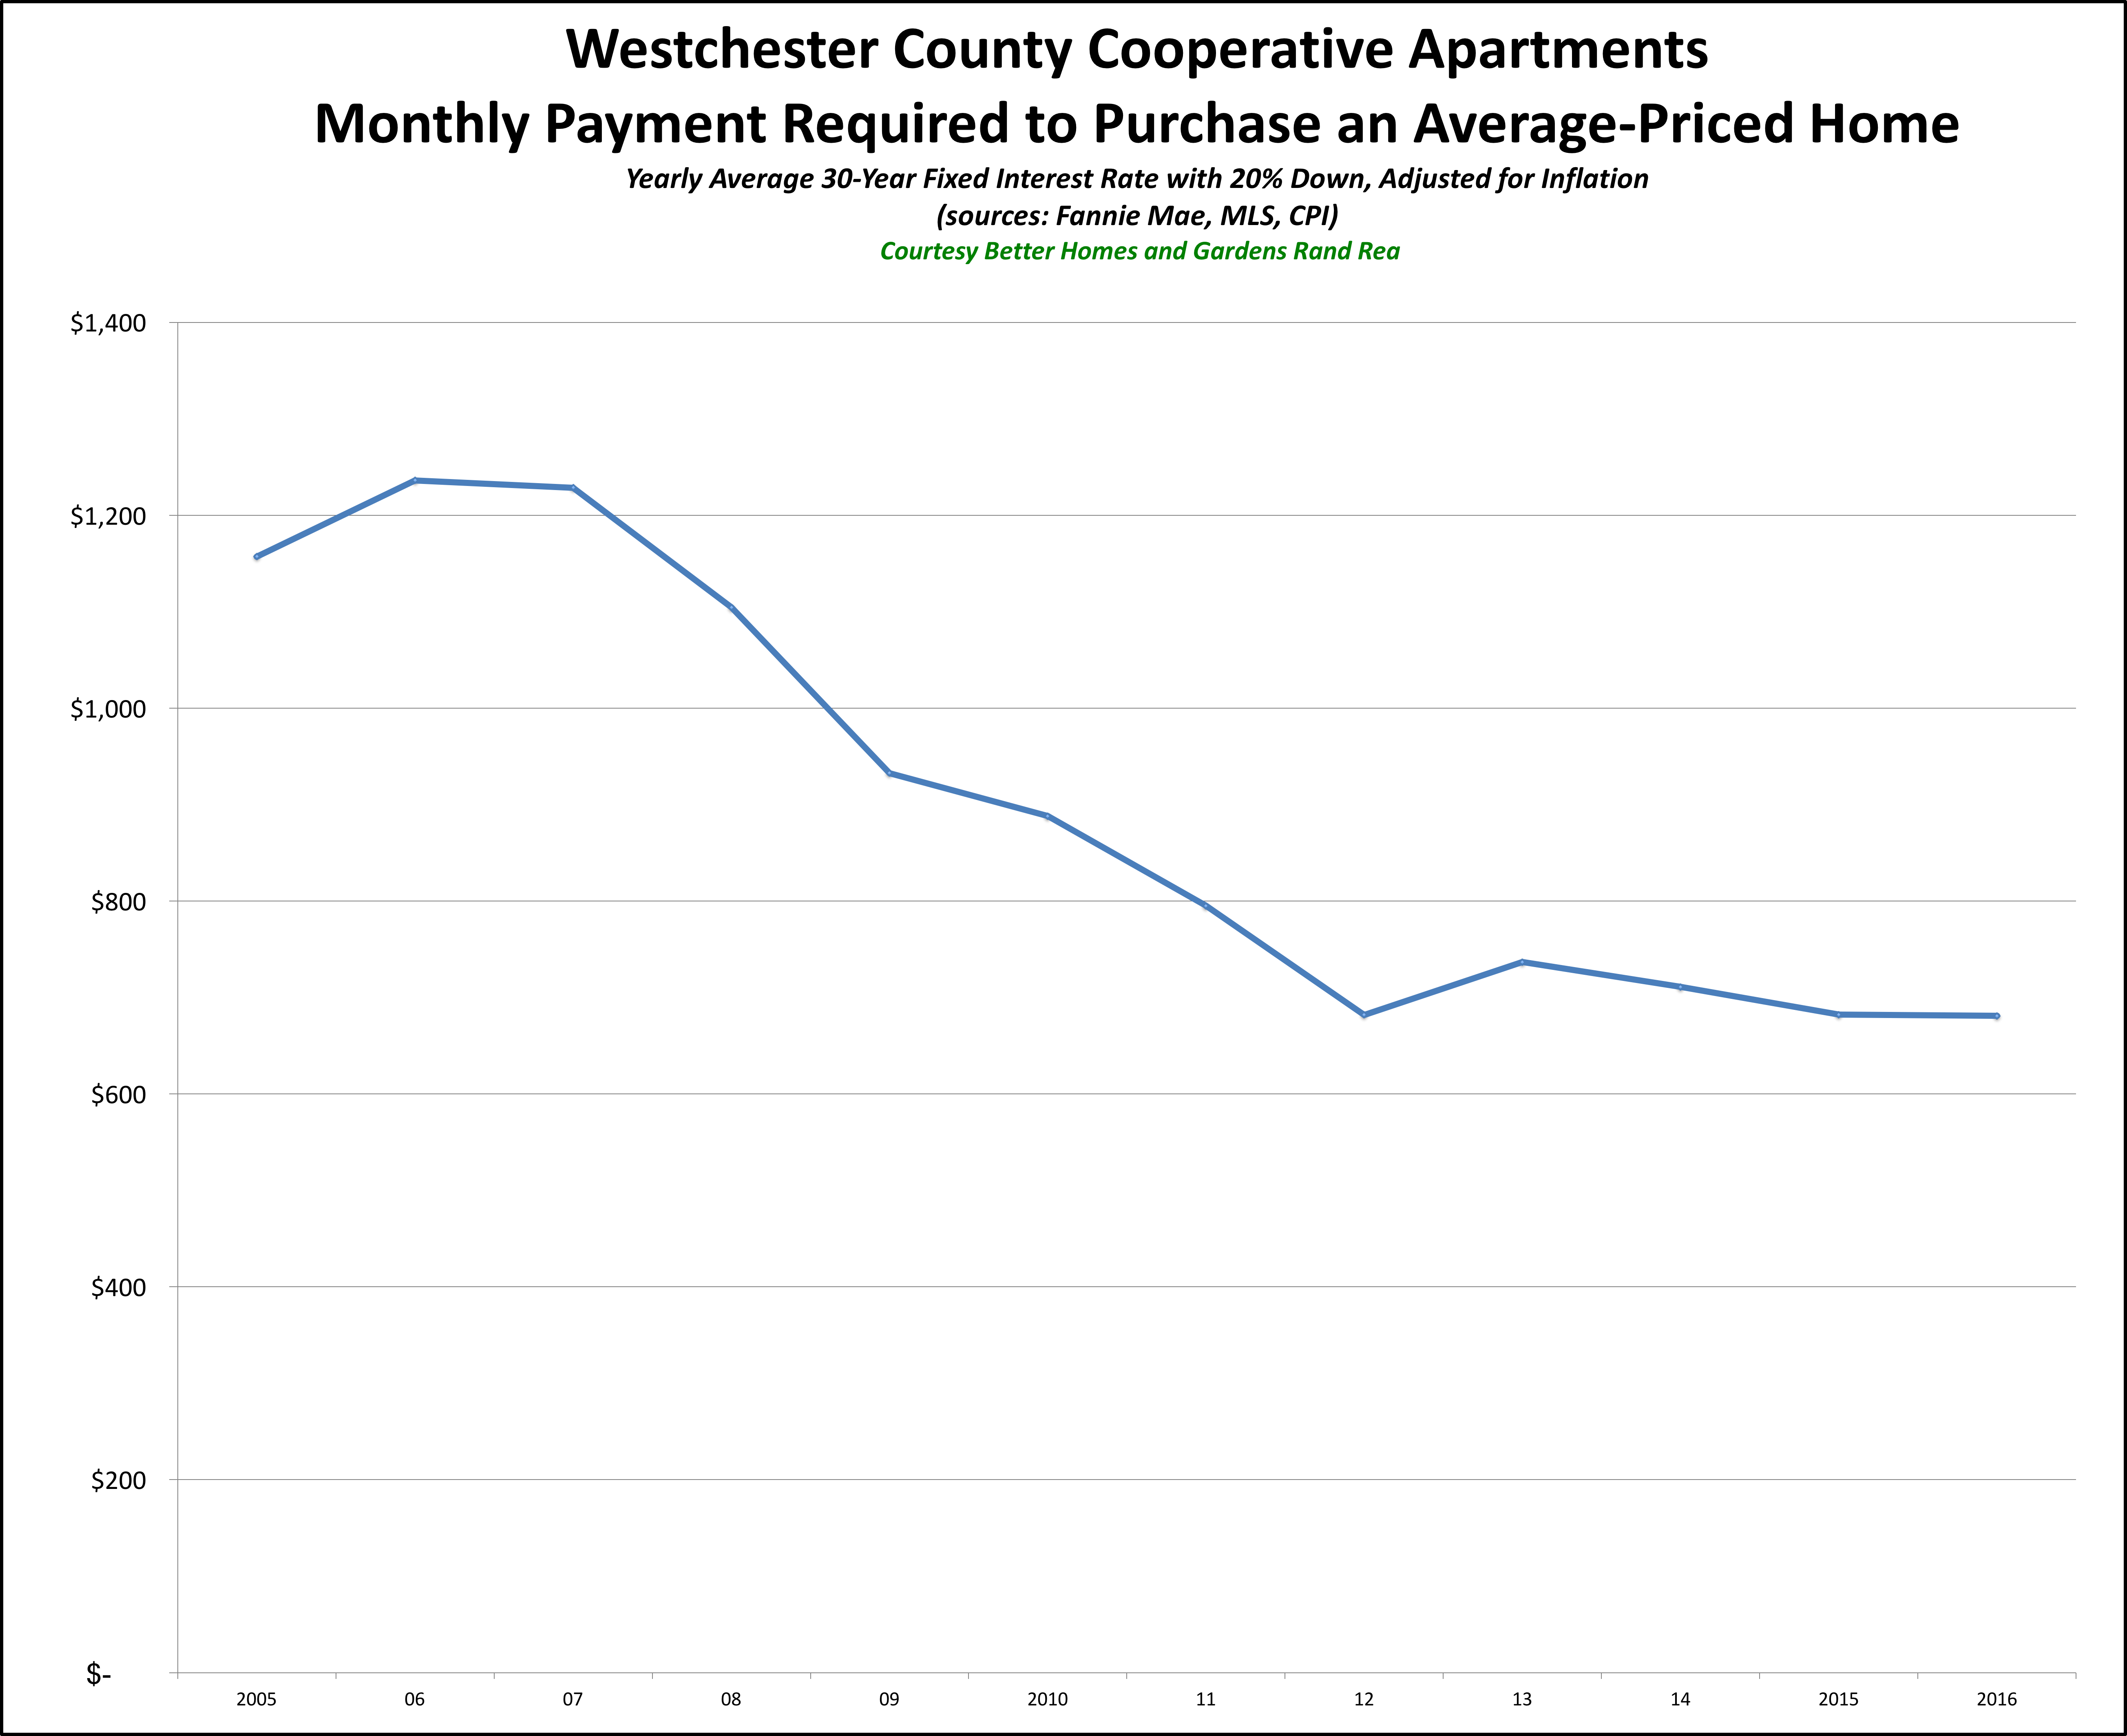
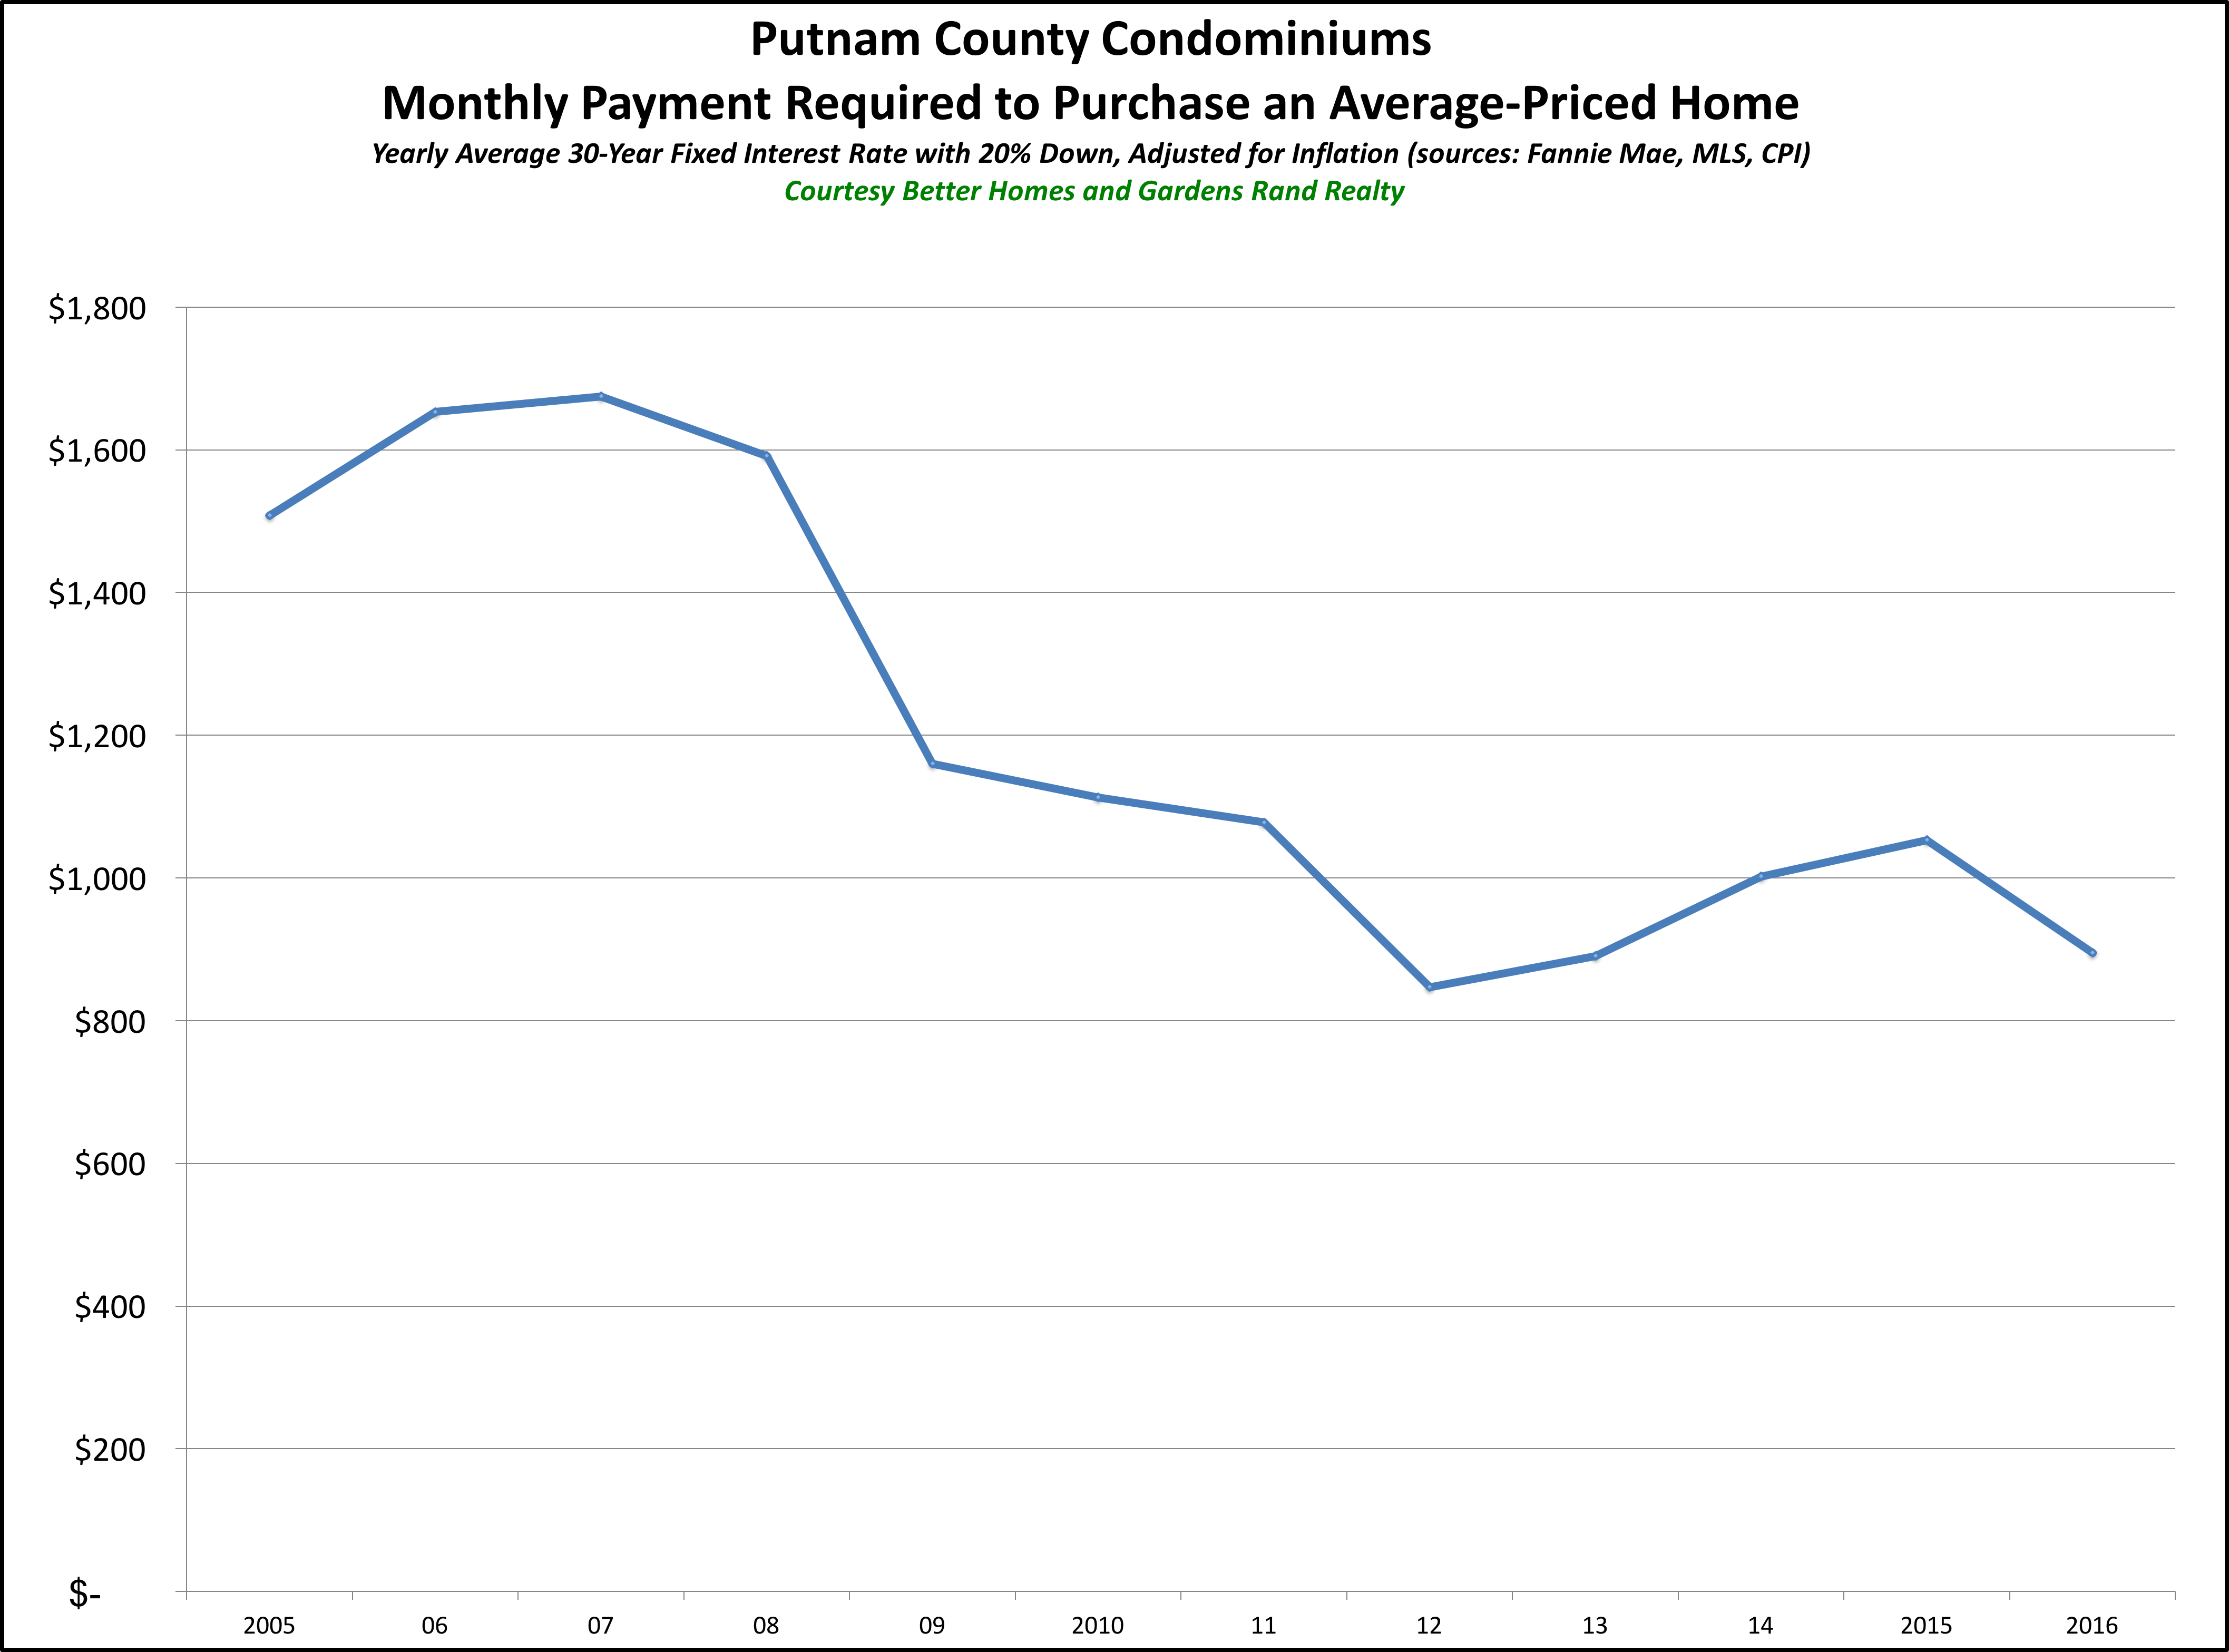
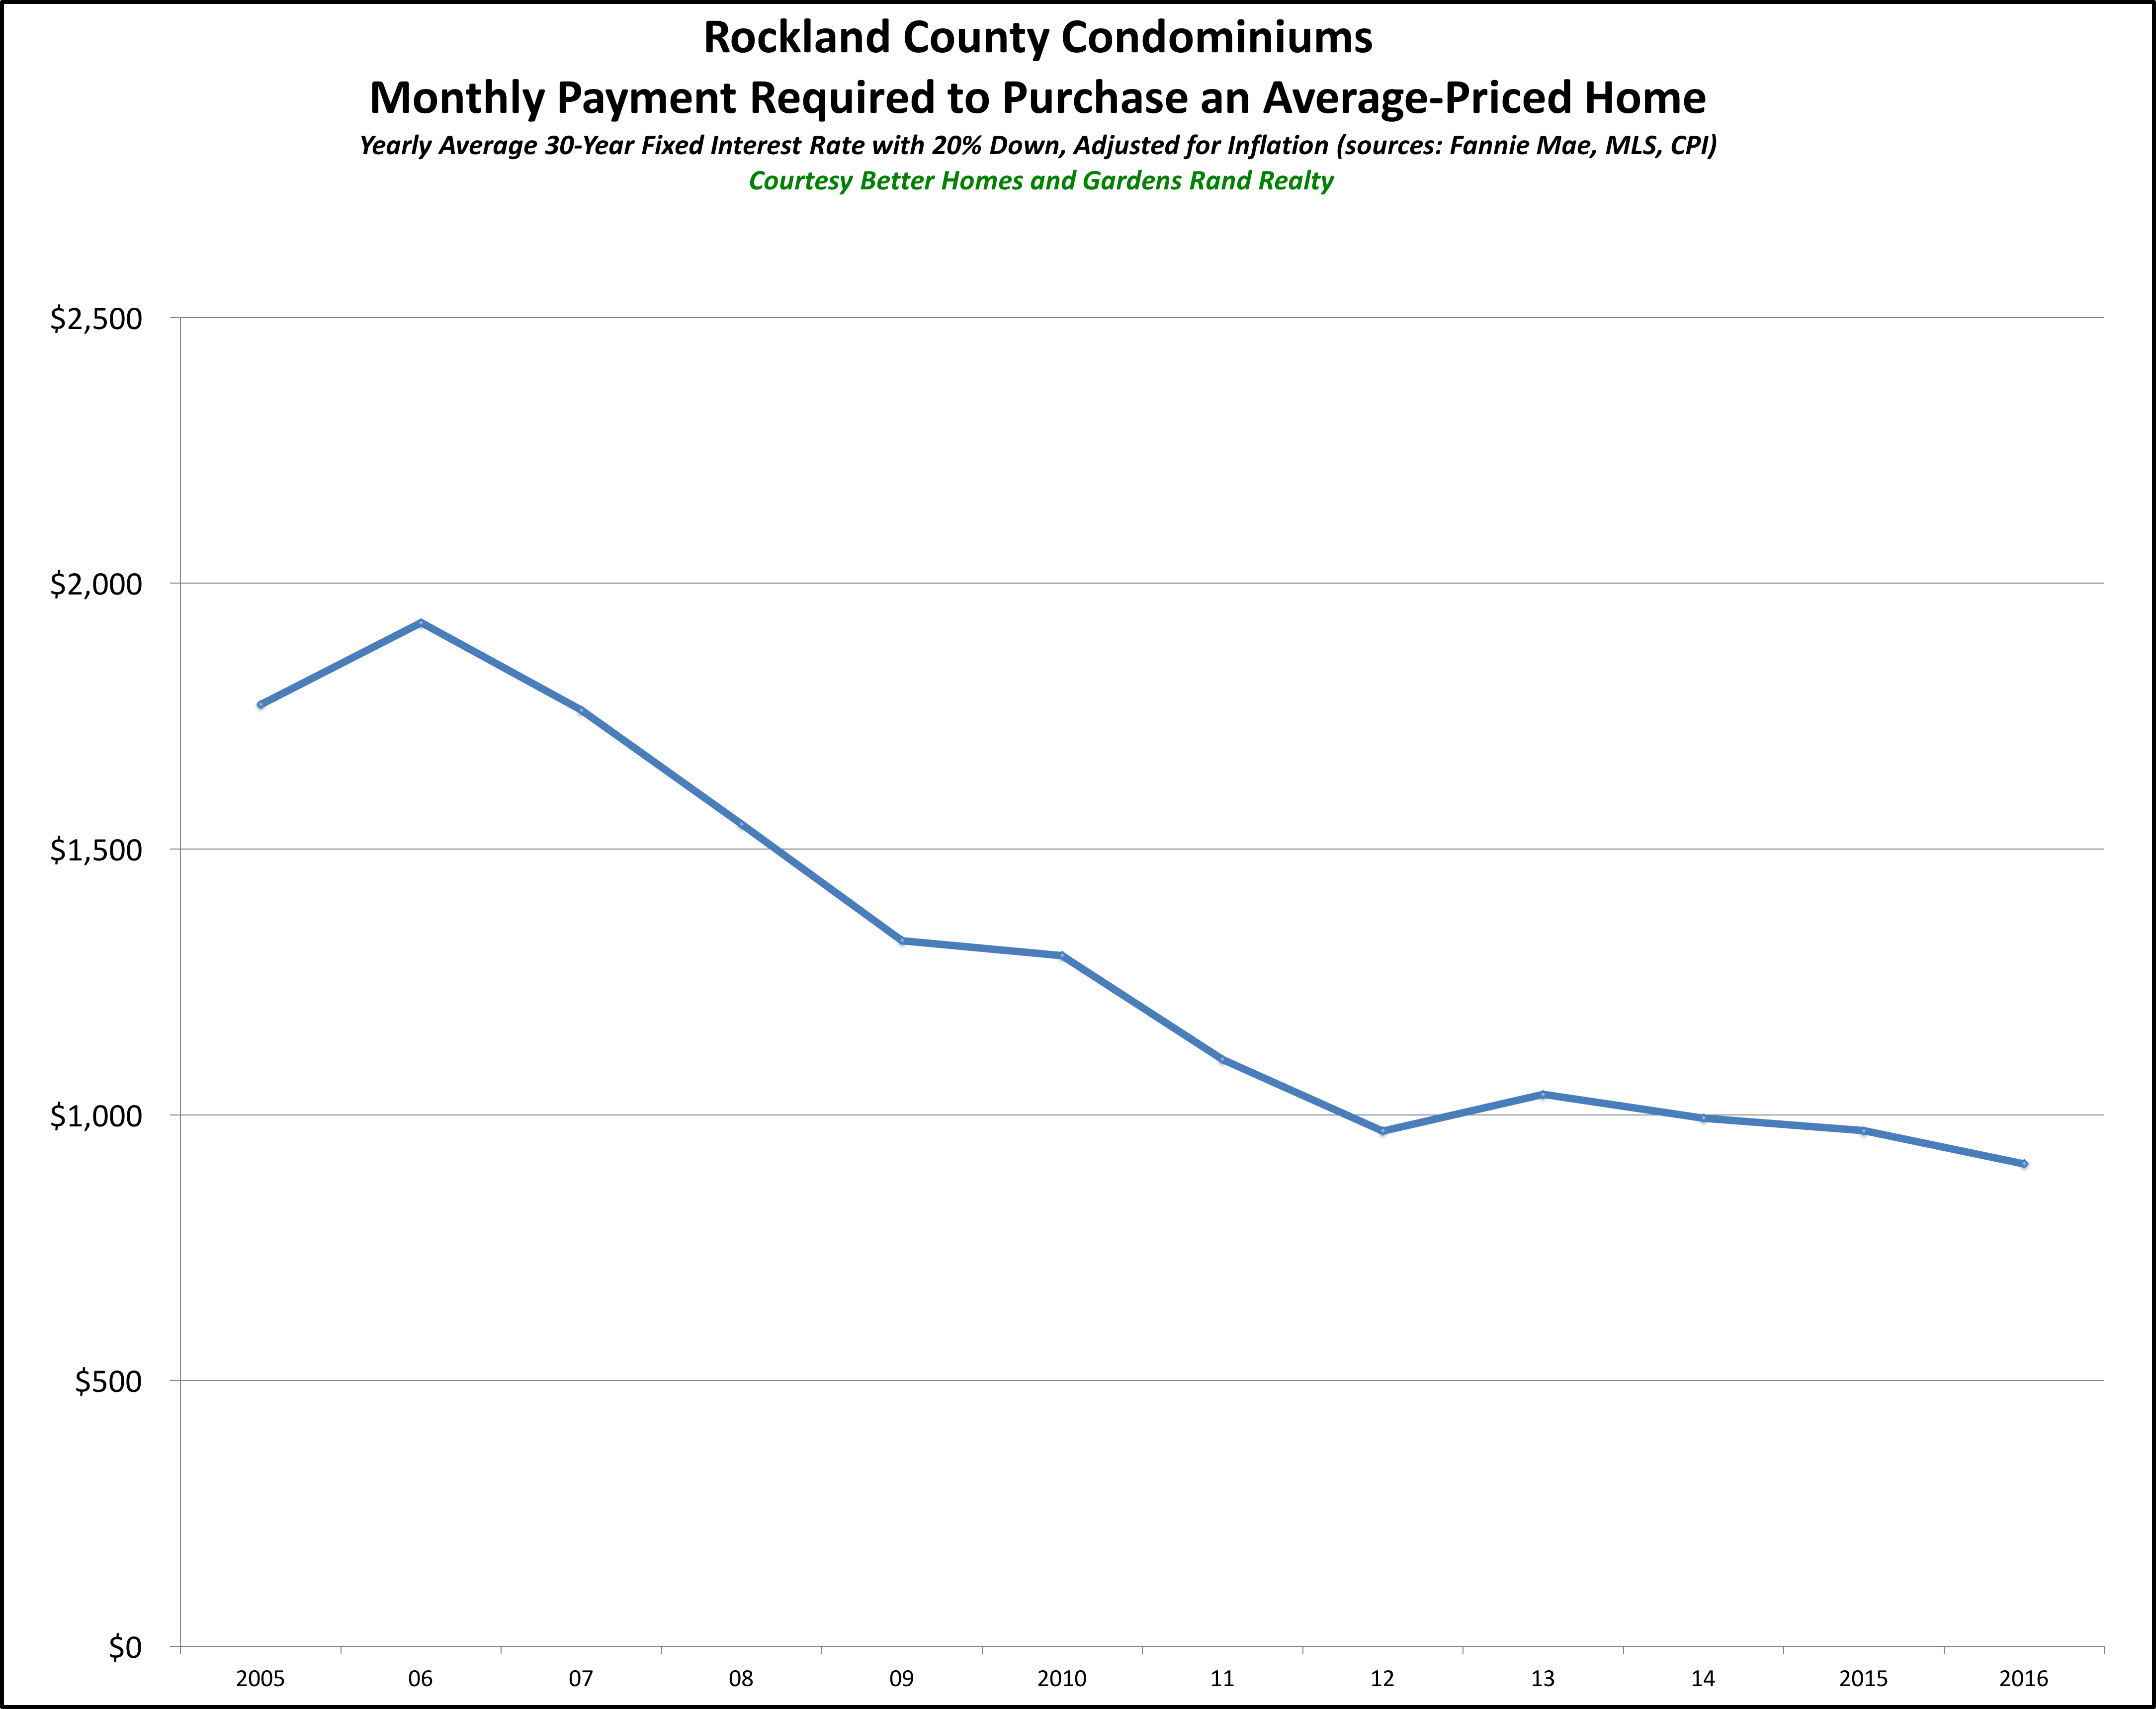
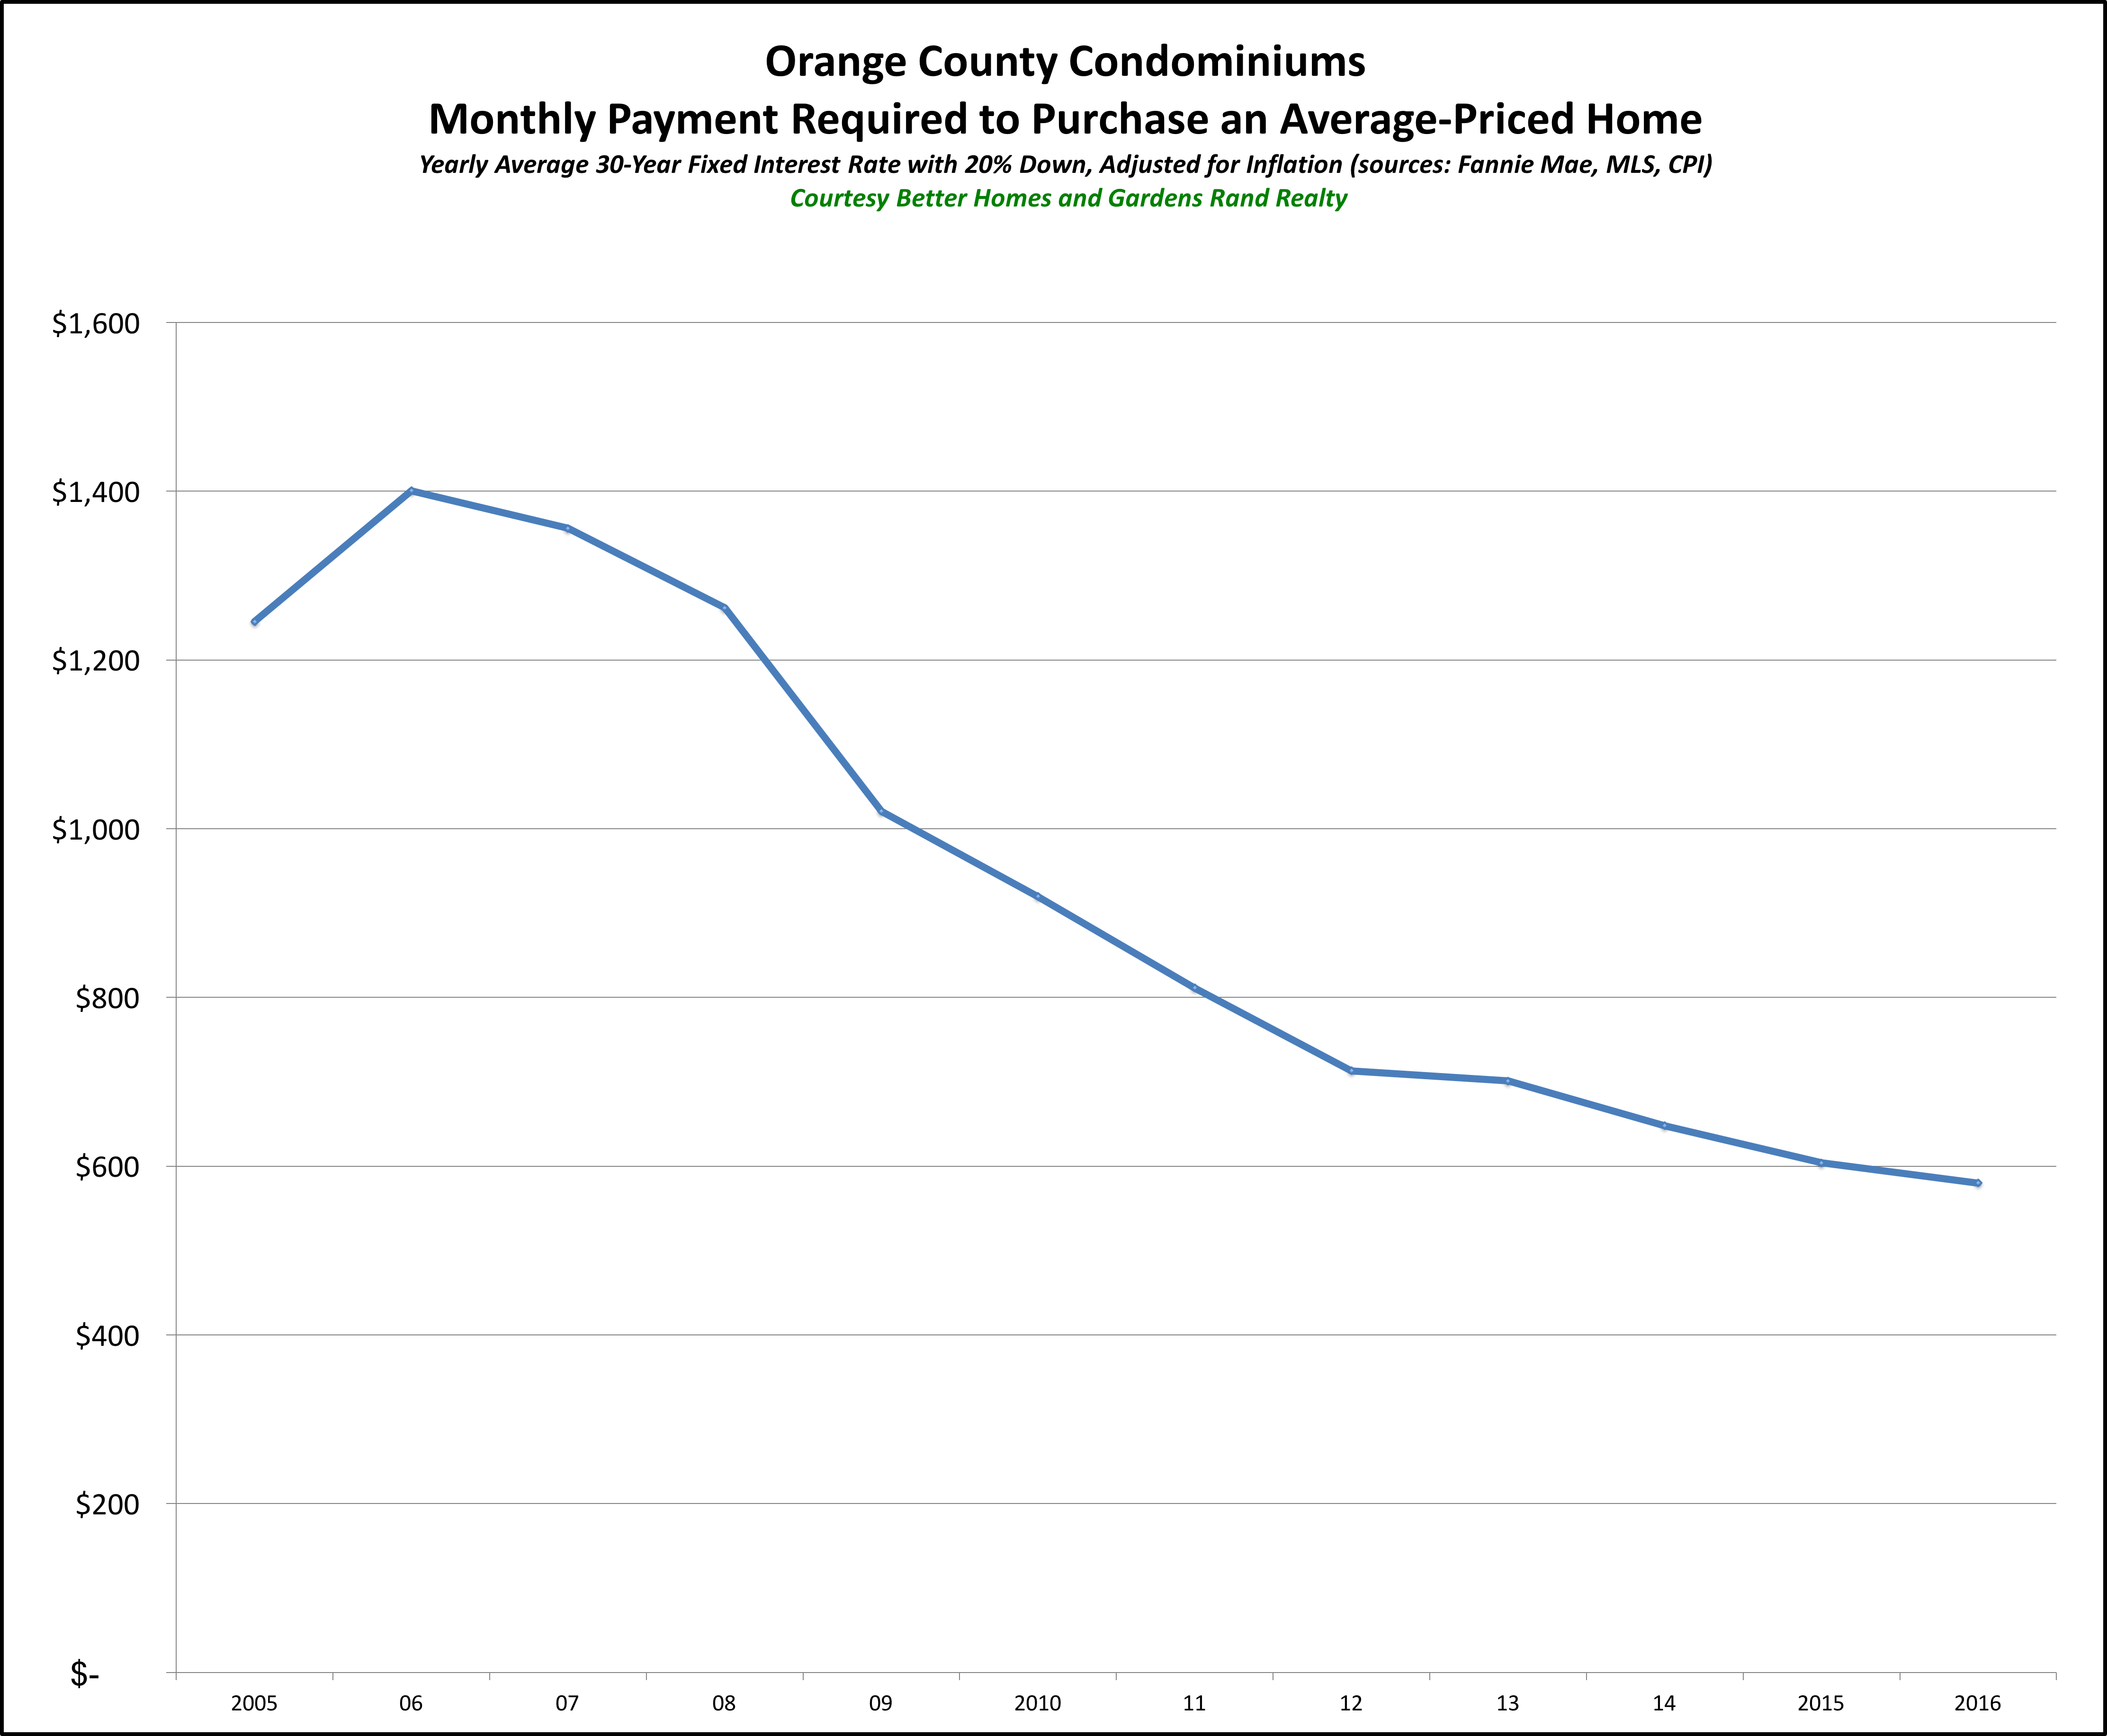
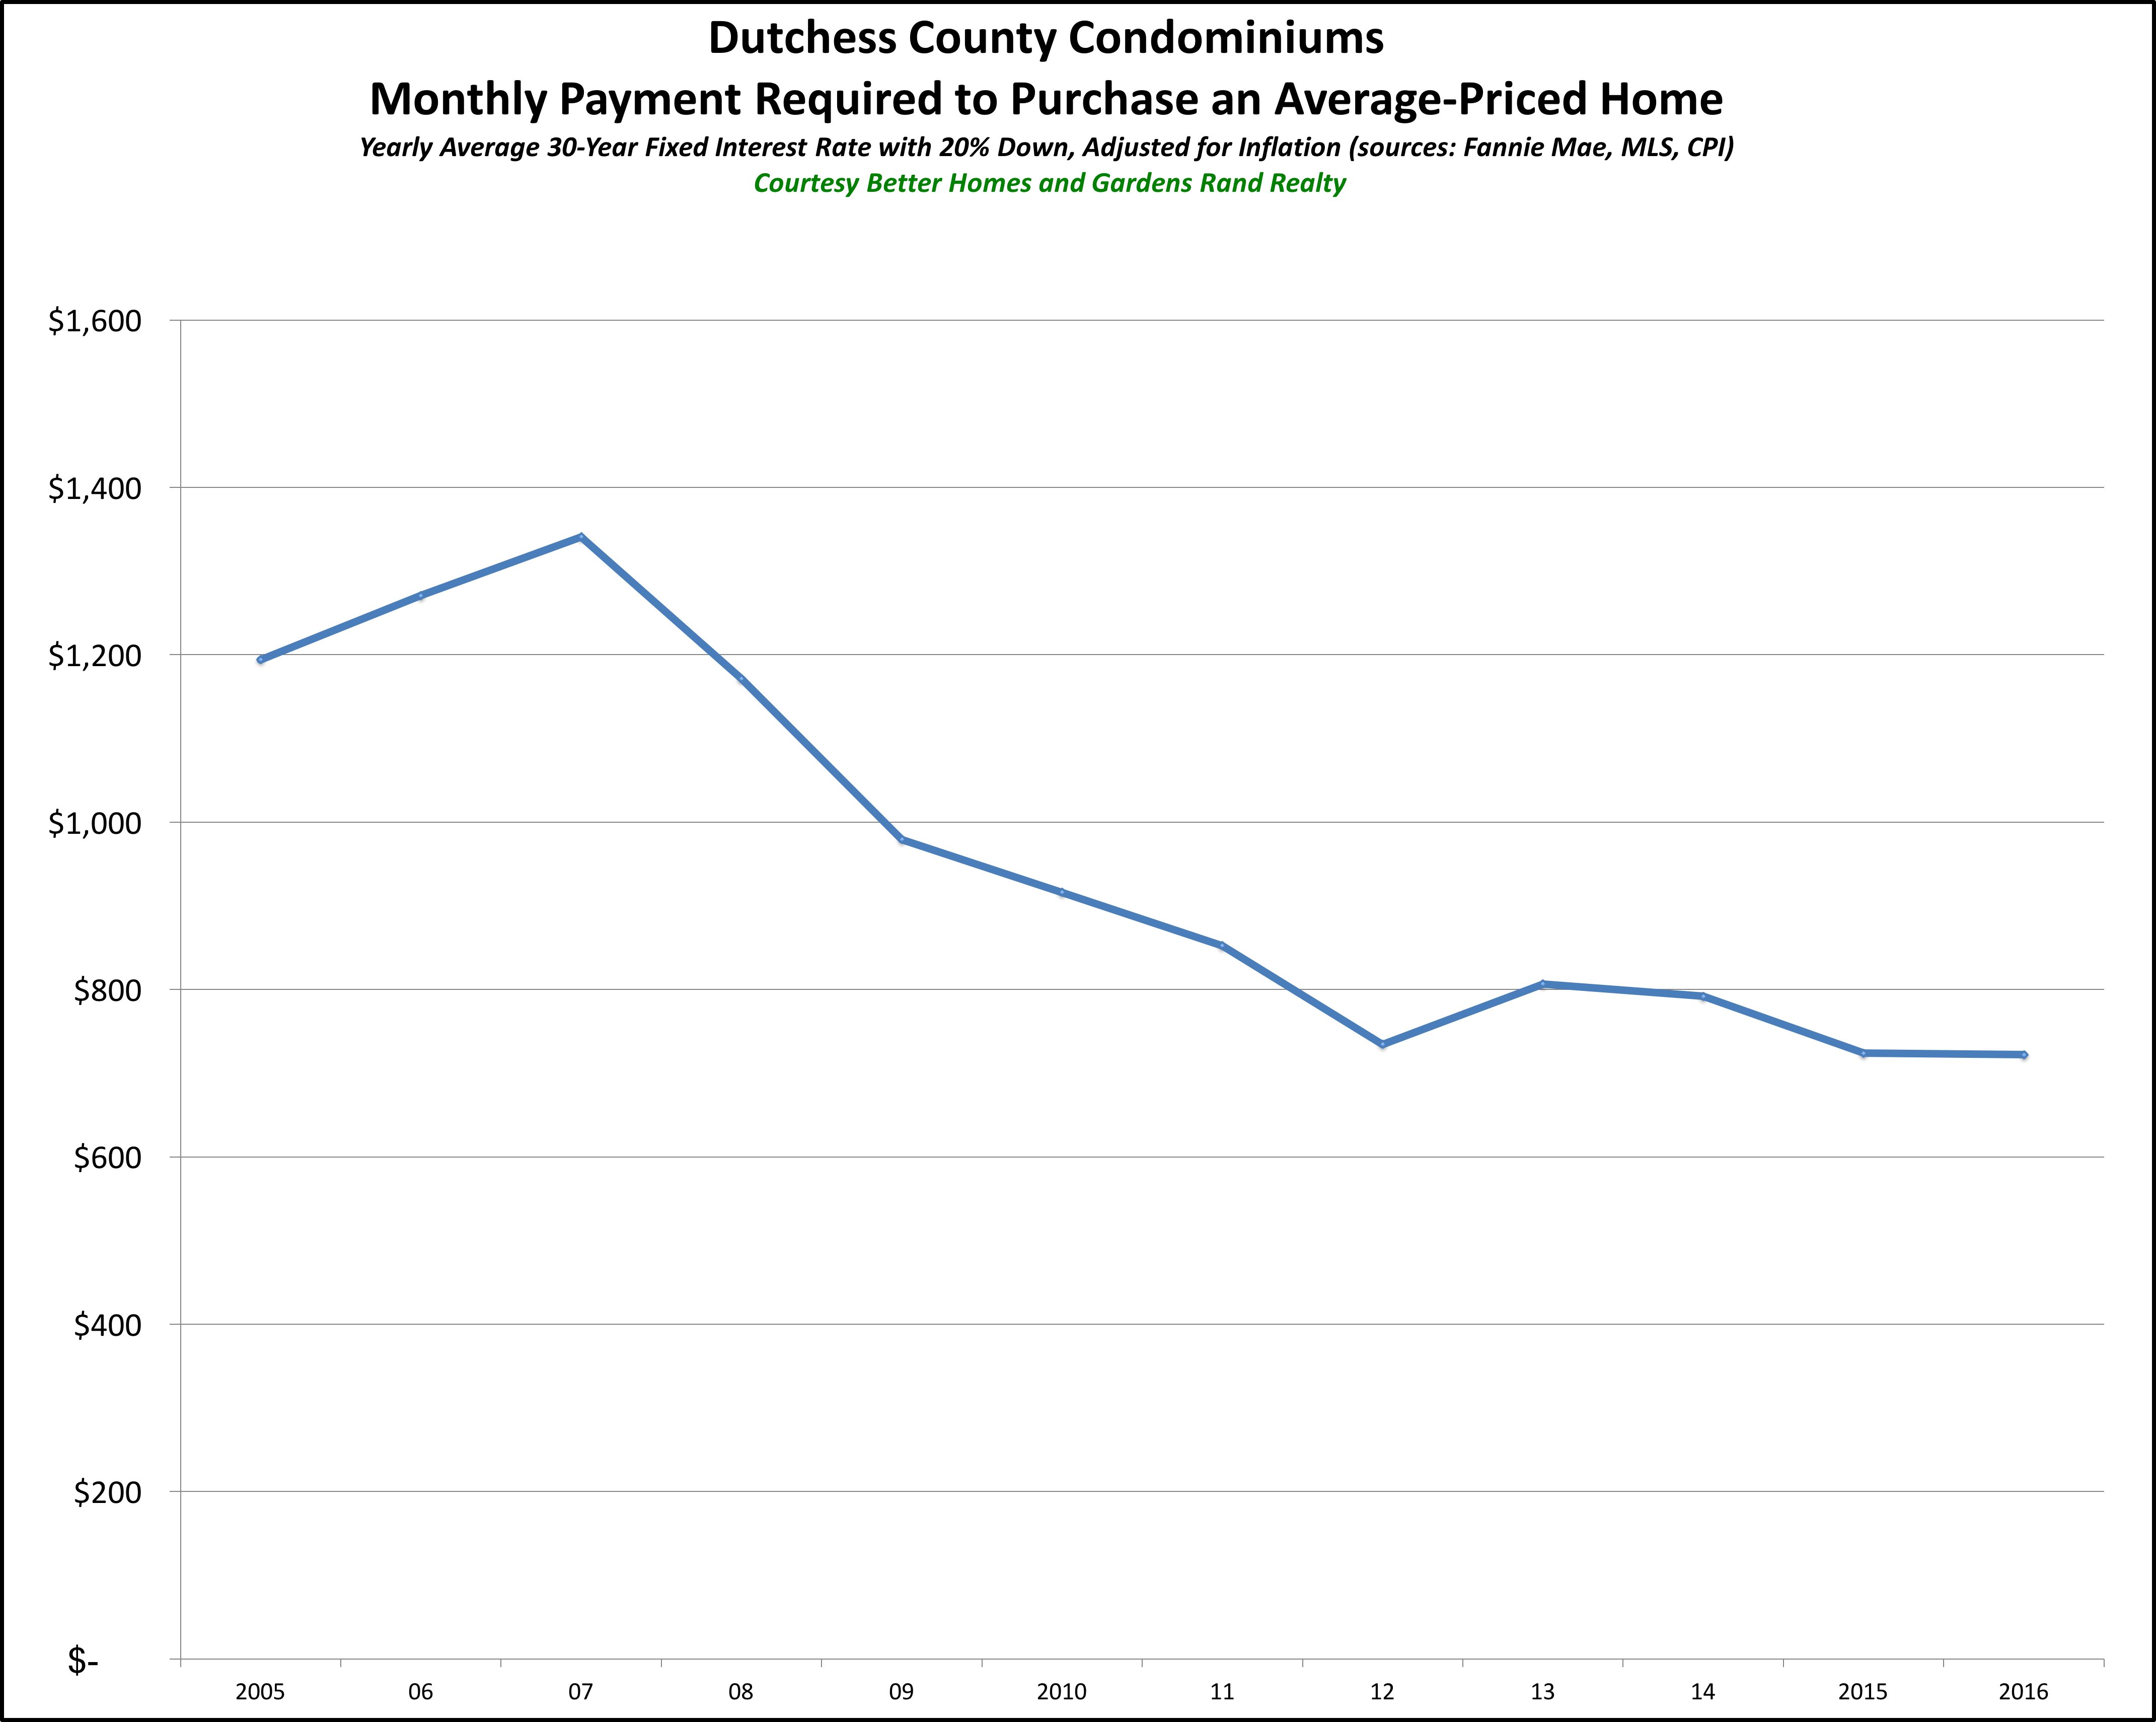
You can see that except for Westchester and Putnam condos, which have seen some pricing changes in the past two years, the monthly payments are lower than any time since 2005. And even in Westchester and Putnam, they’re lower now than at any time in the last decade, just a little higher than the last two years.
We wrote this up last year, and predicted that 2015 would be the last time we’d be able to say it. Surprisingly, though, prices stayed flat for 2016 while rates stayed down, so we have yet another year where the real monthly payment you have to make to buy the average-priced home in our region is lower than it’s been in years.
Conclusion
Again, I HATE it when real estate professionals say that “this is a great time to buy,” because at many times in our history that has been bad advice.
But if you measure a “great time to buy” by looking at the monthly payment you’ll have to make to buy a home, then we’re talking about as good a time to buy as any in the past decades. Prices have been flat for almost 10 years, and they’re down significantly if you factor in the effects of inflation. And interest rates are still as low as we’ve ever seen them. Unless we see some major shock to the economy, I think we’re looking at a near-decade of reasonable price appreciation coupled with increasing interest rates – both of which are going to drive that monthly payment up over the next few years.
So I’m not going to tell you what to do. That’s not my job. But if you’ve been thinking about buying a home, I think these graphs speak for themselves.
Joe Rand is the Chief Creative Officer of Better Homes and Gardens Real Estate | Rand Realty, and compiles and writes the Rand Quarterly Market Report.
To learn more about Better Homes and Gardens Real Estate Rand Realty, visit their website and Facebook page, and make sure to “Like” their page. You can also follow them on Twitter.
Homes in Westchester and the Hudson Valley are STILL Cheaper Than They Have Been in a Generation
Right now is a really great time to be buying a home in Westchester or the Hudson Valley.
Man, do I hate saying that. As I’ve explained before, I hate the phrase “great time to buy” for a couple of reasons.
First, people have different needs, and a market that’s great for one person might be terrible for another person.
Second, while markets tend to move together, we do see micro-markets (i.e., towns and villages) that defy larger trends. So while it might be a great time to buy in Village A, it might be not so great in Town B.
Third, and most importantly, though, “it’s a great time to buy!” just seems like a hack thing to say, the kind of thing that TERRIBLE real estate agents have said for generations to get unsuspecting and gullible people to buy an overpriced home. And I think that most people get suspicious when real estate agents talk like that.
So I understand if you’re skeptical. And that’s why I don’t want to just TELL you it’s a great time to buy, I want to SHOW you why it’s a great time to buy.
Specifically, I want to make this specific point: the monthly payment you need to buy an inflation-adjusted average priced home in Westchester and the Hudson Valley is as low as its been in a generation.
Think about what I’m saying for a second. I’m NOT saying that homes are cheaper than they’ve ever been. That’s not true. Depending on the year, homes have appreciated, and if you go back more than 15 years, they’ve appreciated pretty dramatically. I’m just saying that the MONTHLY PAYMENT you need to make to buy the AVERAGE PRICED HOME is lower right now than it’s been in a generation — if you control for the effects of inflation.
If you look at the graph below for Westchester County, you’ll see what I mean.

On that graph, as we’ve done before, we’ve plotted the monthly payment that a purchaser in the county would have to make to purchase the average-priced home at various points over the years. After all, affordability is not just a matter of the sales price – it’s a matter of the monthly payment you’re going to have to make, which is partly a function of the prevailing interest rate. And then to measure the change in the monthly payment over time, we factored in the effects of inflation.
So we took the following data points:
- The average price of a single family home up to the end of 2016 – from the local MLS data.
- The average interest rate for a 30-year fixed-rate mortgage for every calendar year up to 2016 – from Freddie Mac.
- The prevailing inflation rate for every calendar year up to 2016– from the US Department of Labor.
You can see the results on the graph. The monthly payment you have to make to purchase the average-priced home in Westchester is just about as low as it’s been in years. We saw the slightest uptick from 2012-2014, partially because of a slight increase in pricing and a slow inflating of interest rates. But the payment came down again over the past two years, with rates falling and prices stalling.
Generally, though, we’re talking about a monthly payment that is as low as anytime in the past 35 years – and as low as it was in the mid-1990s, during a crippling buyer’s market.
So why are monthly payments lower than they’ve been in a generation? A couple of reasons:
- Prices. Part of it is that we have not seen prices go up in any measurable way in almost 10 years. Home prices peaked in 2006-08, lost about 25-30% of value from 2008-2010, and have bounced around a little since then. But they’re still around 2004 levels — without controlling for inflation.
- Inflation. Ah, yes, inflation — the value of money goes down a little bit each year as inflation takes a bite. Now, inflation rates have been pretty low over the past 15 years from historical standards, but that little bit each year does add up.
- Rates. But the biggest reason we’re seeing monthly payments lower than they’ve been in a generation is that rates are still at historic lows. After all, about ten years ago, the average interest rate was about 6%. For the past few years, it’s been below 4%. That’s a huge difference in your monthly payment.
And the same is true throughout the Hudson Valley. I showed you Westchester first because we have good data on prices for the county going back all the way to 1981. In other counties, our data doesn’t go back as far, but if we look at each of those counties you can see that it’s pretty much the same story for the time period we have.
Orange County. Here’s Orange County, where we have data going back to 1994:

You can see that the monthly payment to buy an average-priced home in Orange County is lower right now than it’s been in over 20 years.
Rockland County. In Rockland, we have data going back to 2002, over 14 years of data.

Again, you can see that even with a slight rise in the past few years, the monthly payment you have to make to buy the average-priced home in Rockland is lower right now than it’s been since at least 2002, and probably for quite a bit of time before that.
Putnam County. Similarly, we have data going back to 2002 in Putnam, and the story is the same:

Dutchess County. Again, same story in Dutchess County for that same period:

And although we don’t have data for Orange, Rockland, Putnam, or Dutchess going back as far as Westchester, the fact that the curve over the recent decade or so is very consistent with Westchester’s results suggests that, like in Westchester, the monthly payment you need to make throughout the Hudson Valley is lower right now than it’s been since the Carter administration.
Condos and Coops. All that’s for single-family homes. What about condos and coops? Well, we don’t have data going back as far, but in each county, condos (and coops in Westchester) show the same trend — the monthly payment to buy an average priced condo or coop in the region is lower right now than it’s been at any time since the 2005 era. Here are the graphs:


You can see that except for Westchester and Putnam condos, which have seen some pricing changes in the past two years, the monthly payments are lower than any time since 2005. And even in Westchester and Putnam, they’re lower now than at any time in the last decade, just a little higher than the last two years.
We wrote this up last year, and predicted that 2015 would be the last time we’d be able to say it. Surprisingly, though, prices stayed flat for 2016 while rates stayed down, so we have yet another year where the real monthly payment you have to make to buy the average-priced home in our region is lower than it’s been in years.
Conclusion
Again, I HATE it when real estate professionals say that “this is a great time to buy,” because at many times in our history that has been bad advice.
But if you measure a “great time to buy” by looking at the monthly payment you’ll have to make to buy a home, then we’re talking about as good a time to buy as any in the past decades. Prices have been flat for almost 10 years, and they’re down significantly if you factor in the effects of inflation. And interest rates are still as low as we’ve ever seen them. Unless we see some major shock to the economy, I think we’re looking at a near-decade of reasonable price appreciation coupled with increasing interest rates – both of which are going to drive that monthly payment up over the next few years.
So I’m not going to tell you what to do. That’s not my job. But if you’ve been thinking about buying a home, I think these graphs speak for themselves.
Joe Rand is the Chief Creative Officer of Better Homes and Gardens Real Estate | Rand Realty, and compiles and writes the Rand Quarterly Market Report.
Are Home Prices in the Manhattan Suburbs Due? — The Big City Exodus Theory

Are home prices in the New York City suburbs on the rise?
We’re not seeing it in the data just yet. Even with home sales up pretty robustly for the past five years, home prices in the Manhattan suburbs have been relatively flat since their financial crisis correction back in 2008-2010. At some point, you have to think that increasing demand with a flat supply is going to drive prices up — just basic Economics 101.
And here’s another theory that bolsters the idea that the suburbs are due for some price appreciation. Conor Sen in Bloomberg View argues that demand for homes in the suburbs is likely to surge in the next few years, driven largely by the simple fact that big-city housing prices are out of whack. Indeed, he analogizes big cities to large cap stocks and suburbs (and smaller cities) to small-cap stocks (this is Bloomberg, after all — everything is about equities….), and thinks that the housing market is like the stock market in the late 1990s, when large caps were overvalued and due for a fall relative to small caps.
Why? Well, basically, two reason. First, home prices in the big cities across this county have soared in the past few years, and at some point people are going to decide that they just don’t want to pay that much to live in Manhattan or San Francisco or wherever. And second, he sees the internet driving job mobility:
The conventional wisdom that the internet would allow people and jobs to leave primary metro areas for secondary ones has run up against the fact that over the past 20 years the opposite has occurred. There are a few problems with this argument. First, at the height of the last housing boom the impact of the internet on daily lives was still quite small. The only people with smartphones were business users who had BlackBerrys. Cloud technology was still in its infancy. For most people, the internet was still a desktop-computer- and email-based experience. Now, with a labor market approaching full employment and the housing market nearing a normal recovery, it would be fair to evaluate the question of whether people will move. And the evidence suggests they will.
Certainly, this makes sense in the New York area, where Manhattan prices have risen dramatically in the past ten years compared to pricing in the surrounding suburbs. To give you an idea of how the market has changed, let’s compare the average sales prices for Manhattan and some of the surrounding suburbs in the past ten years.
First, Manhattan. According to the market reports put out by the Corcoran Group, the average Manhattan home is now priced about 60% higher than it was ten years ago in 2006. Here are the numbers, with links to the market reports:
- 2006Q2:$1,247,000
- 2016Q2: $1,994,000
- Difference: $747,000 (+59.9%)
Okay, so Manhattan is up 60% in the past ten years. Now, let’s look at what’s happened with pricing in some of the surrounding markets over that same time period. We have done a quarterly market report every quarter for about 15 years for the New York suburbs, so we can get the data there:
- 2006Q2:$938,825
- 2016Q2: $841,549
- Difference: -$97,276 (-10.4%)
- 2006Q2: $567,277
- 2016Q2: $465,795
- Difference: -$101,482 (-17.9%)
- 2006Q2:$351,538
- 2016Q2: $228,037
- Difference: -$123,501 (-35.1%)
- 2006Q2:$483605
- 2016Q2: $362,584
- Difference: -$121,021 (-25.0%)
In other words, while the average price in Manhattan is up almost 60%, the pricing in the New York suburbs is down between 10% (Westchester) and 35% (Orange).
And it’s the same in the New Jersey suburbs to the west of Manhattan. We don’t have market reports going back as far in that county, but we do have the calendar year average prices going back that far. So here’s a comparison of the average price for the past rolling year ending in June, and the calendar year price in 2006:
- 2006 (calendar year): $680,313
- 2016Q2 (rolling year): $569,484
- Difference: -$110,829 (-16.2%)
- 2006 (calendar year): $396,703
- 2016Q2 (rolling year): $312,000
- Difference: -$84,703 (-21.3%)
Same thing: while Manhattan is up almost 60%, Bergen is down 16% and Passaic is down over 21%
And how about the eastern suburbs — i.e., Long Island? We don’t cover that market, so I don’t have market reports handy, but if you look on Zillow’s median price index, you can see that the median prices (not the average) in Nassau and Suffolk Counties have done the following:
- August 2006 Median Price: $510,000
- August 2016 Median Price: $469,000
- Difference: -41,000 (-8.0%).
- August 2006 Median Price: $447,000
- August 2016 Median Price: $343,000
- Difference: -104,000 (-23.2%).
You have to be a little careful comparing averages to medians, but the trend is still pretty clear: Manhattan is up, and all the surrounding suburbs are down.
So does that bear out the thesis that home prices in these suburbs are due? Maybe. Certainly, it’s amazing how well Manhattan has done over the past ten years, rising almost 60% while the surrounding suburbs have still not recovered from the 2008 financial crisis. And it’s puzzling that this kind of rampant appreciation has had little or no impact on suburbs that are right on the border.
Think of it this way: back in 2006, the average price of a Manhattan home was $1,25M, which was 33% higher than the average priced home in Westchester. Today, the average Manhattan home is almost $2.0M, which is 137% higher than the average priced home in Westchester. That seems a little nuts, particularly when you think about what $2.0 buys you in Westchester.
Now, it might just be that the imbalance could be corrected in another way — Manhattan prices could just go down, rather than suburban prices going up. But I think that we have good reasons to be optimistic about suburban pricing. We have a strengthening economy, low interest rates, good employment, and a lot of twentysomethings who can’t afford a home in Manhattan and are likely to start looking outside the city in the next few years.
Why is the Westchester Average Sales Price Down, When Sales Are Way Up?

Why are Westchester prices down?
If you look at the Westchester single-family housing market, comparing the year-to-date 2016 to 2015 as of the end of May, what you find is a little perplexing: sales are up 12%, but prices are sharply down across the board: down 7% on average, 5% at the median, and 4% in the price-per-square-foot.
And by “perplexing,” I mean “if I was a Westchester homeowner, this would kind of freak me out!”
| Westchester | 2015YTD | 2016YTD | Change |
| Sales | 1,688 | 1,891 | 12% |
| Average | $837,313 | $775,879 | -7% |
| Median | $610,000 | $582,500 | -5% |
| PPSF | $320 | $307 | -4% |
| Original | 92.7% | 93.2% | 0.5% |
| Last | 96.3% | 96.7% | 0.4% |
| DOM | 190 | 176 | -7% |
| Inventory | 3,505 | 3,408 | -3% |
It’s really very strange. I mean, all the other indicators, including the existing inventory, the days-on-market, and the listing retention rate, show that fewer homes are hitting the market, the ones on the market are selling more quickly, and they’re selling for closer to the asking price — the hallmarks of a seller’s market.
So if sales are up, inventory is down, and homes are selling more briskly, how can prices be down? That doesn’t make sense, if you thiknk about basic economic fundamentals: if inventory is down, and demand is up, price should go up. Right?
Well, if you look a little deeper at the results, you can see what’s going on. Essentially, the market in Westchester is really strong right now, but it’s disproportionately strong in the lower end of the market.
Take a look at this stratification of the market over the first five months of 2015 versus 2016:
| Sales in Each Pricing Range | May 2015YTD | May 2016YTD | Change |
| $-$499,999 | 603 | 724 | 20.1% |
| $500,000-$999,999 | 704 | 787 | 11.8% |
| $1M-$1,499,999 | 181 | 202 | 11.6% |
| $1.5M-$1,999,999 | 87 | 79 | -9.2% |
| $2M+ | 104 | 89 | -14.4% |
What you can see is that sales below $500,000 are up about 20%, while sales above $1.5M are actually down about 9%. That is, while Westchester single-family sales are up 12% from last year, that increase is largely coming in the lower end of the market.
Indeed, if you just break it down by the million-dollar mark, here’s what you get:
| Sales in Each Pricing Range | May 2015YTD | May 2016YTD | Change |
| 0-$999,999 | 1,307 | 1,511 | 15.6% |
| $1M+ | 372 | 370 | -0.5% |
Just look at that: sales below $1M are up 15.6, but sales above $1M are basically flat.
So that’s why the average price in Westchester is down right now: we’re seeing a change in the mix of properties, with entry-level or lower-priced homes selling more briskly than high-end homes. Now, that doesn’t mean that the high-end is “slow.” It’s actually doing just fine, down just a tick from last year. But it’s not as “hot” as the lower-end of the market, and that influx of lower-priced homes is skewing the average sales price down.
Indeed, if you look at the change of the average sales price within each pricing strata, what you see is this:
| Sales in Each Pricing Range | May 2015YTD | May 2016YTD | Change |
| $-$499,999 | $364,528 | $350,993 | -3.7% |
| $500,000-$999,999 | $708,706 | $697,799 | -1.5% |
| $1M-$1,499,999 | $1,240,365 | $1,226,895 | -1.1% |
| $1.5M-$1,999,999 | $1,679,957 | $1,701,445 | 1.3% |
| $2M+ | $3,091,409 | $3,120,334 | 0.9% |
In other words, even though the average price in all of Westchester is down 7%, the average price in the individual price ranges is relatively flat. In fact, the average price of homes sold above $1.5M is actually up, which tells us that the upper end is not suffering at all from a lack of demand.
And when you see that the average price for sales in the sub-$500,000 range are down almost 4%, even while sales are up over 20%, you have to conclude that we’re seeing the same dynamic at play. Even within the segment, sales at the lower end are more brisk, driving the average price of that pricing strata down.
In other words, if you’re a homeowner in Westchester, don’t panic when you see that the average price is down from last year. Most likely, the value of your home is probably up a bit. It’s just that the average is comprised of a lot more lower-end sales than we had last year.
Meanwhile, sales are way up and inventory is way down. Homes are selling quickly and for relatively closer to the asking price. If you’re a homeowner in Westchester right now, this is very good news.
It’s all going to be okay.
Joe Rand is a Managing Partner for Better Homes and Gardens Rand Realty, and writes the Rand Quarterly Market Report, which will be coming out in July.


