
 Facebook
 X
X
 Pinterest
 Copy Link
Fourth-Quarter 2018: Real Estate Market Report – Dutchess County, NY
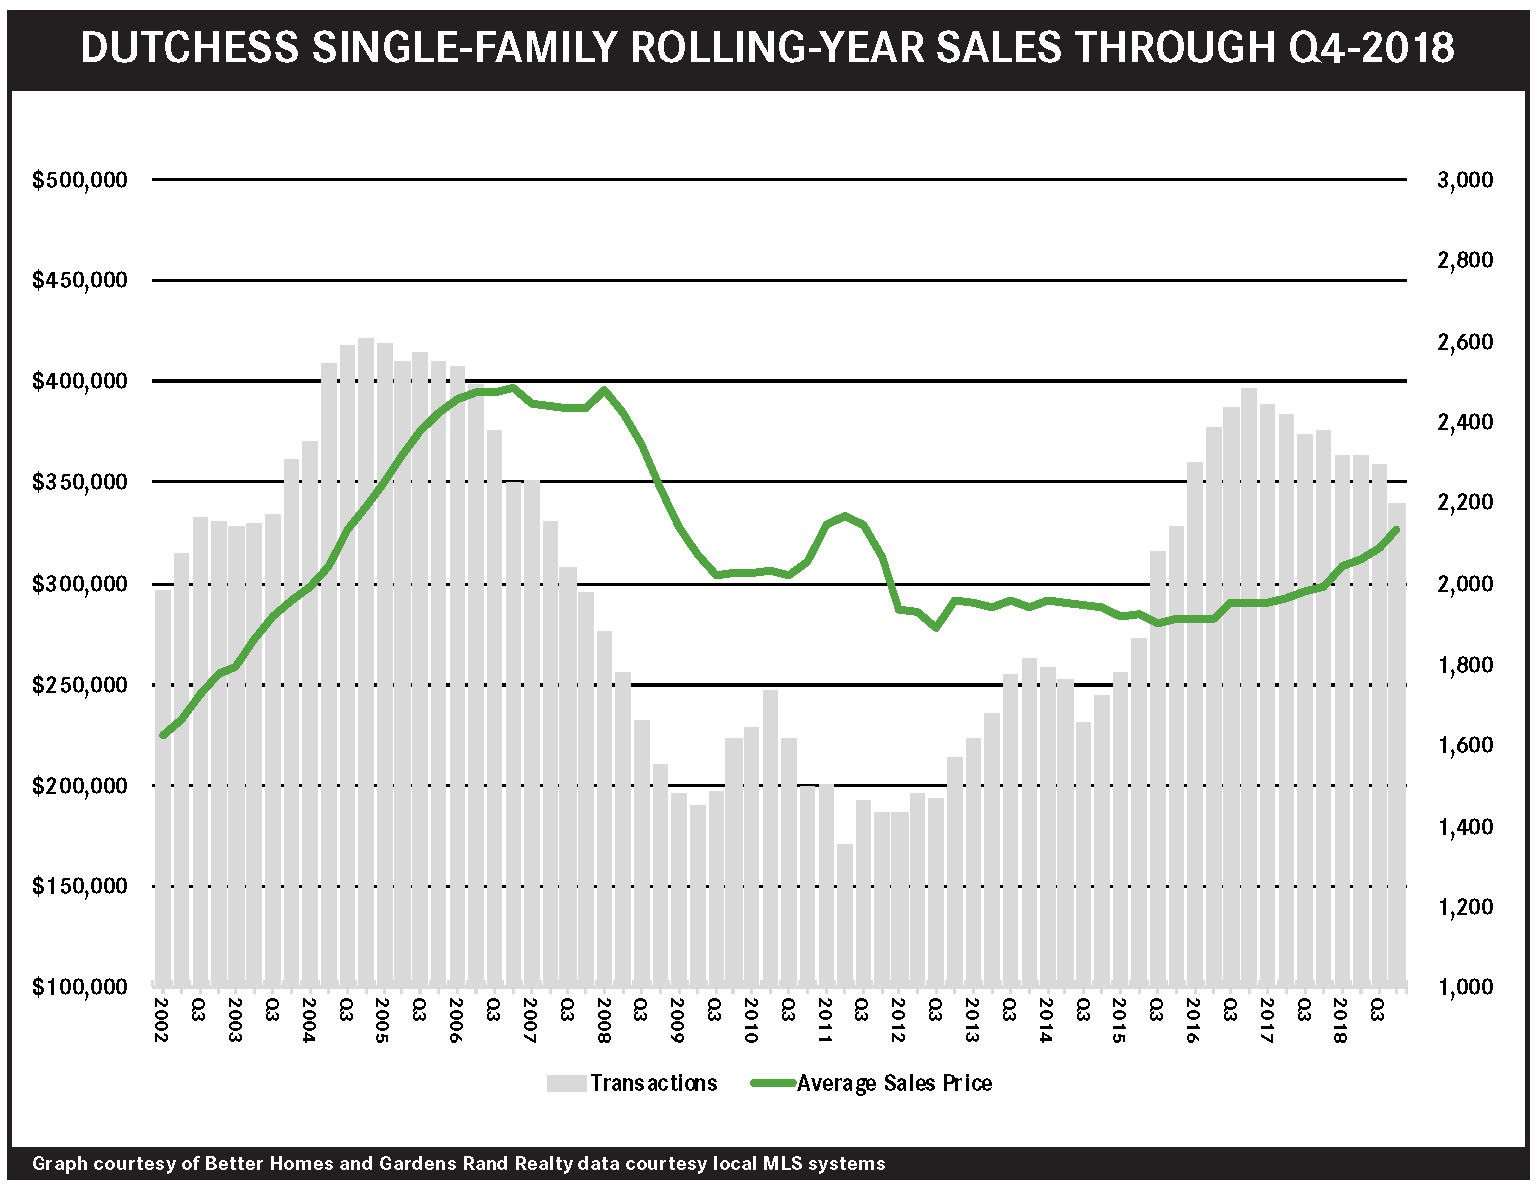
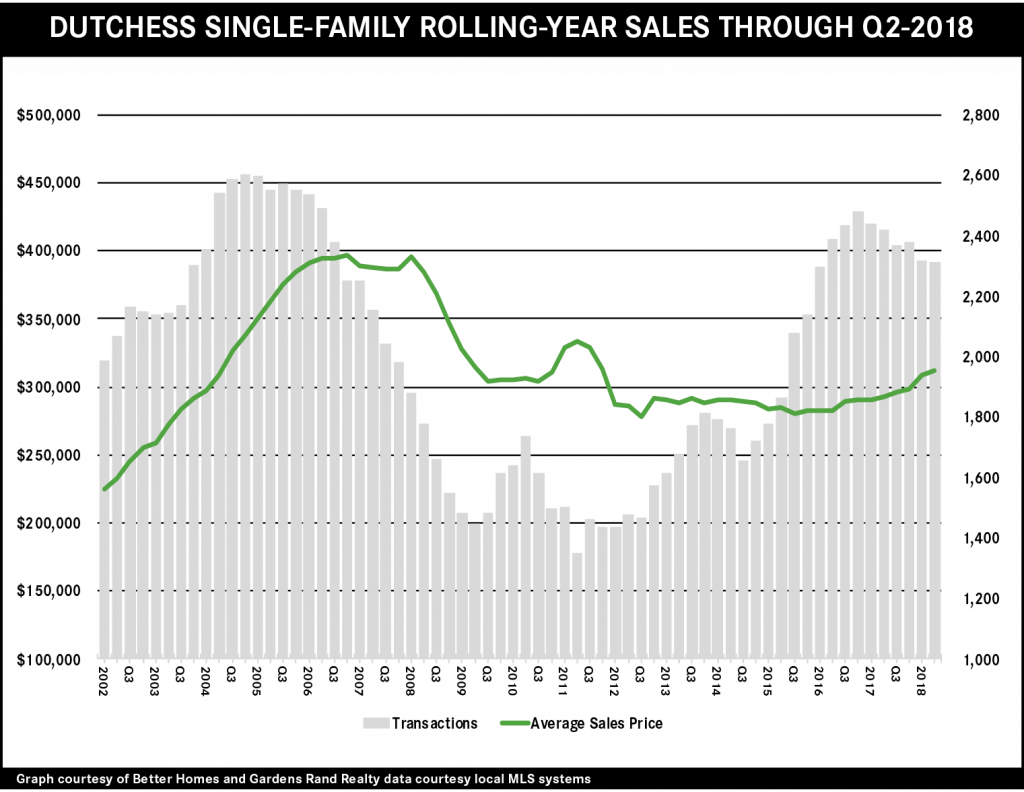
Pricing in the Dutchess housing market soared again in the fourth quarter, with prices rising from high demand and limited inventory. Sales were down, just as in the rest of the region, with low levels of inventory holding back the market. But prices were up across the board: single‑family home prices rose over 12% on average and 6% at the median for the quarter, finishing the 2018 year up almost 10% on average and over 9% at the median. And we saw the same results in the condo market, with the full‑year prices rising 7% on average and almost 5% at the median. Going forward, we expect that sellers will eventually be attracted into this rising market, which might drive sales up in the winter and spring markets.
To learn more about Better Homes and Gardens Real Estate Rand Realty, visit their website and Facebook page, and make sure to “Like” their page. You can also follow them on Twitter, Pinterest, and Instagram.
Fourth Quarter 2018: Real Estate Market Report – Lower Hudson Valley, NY
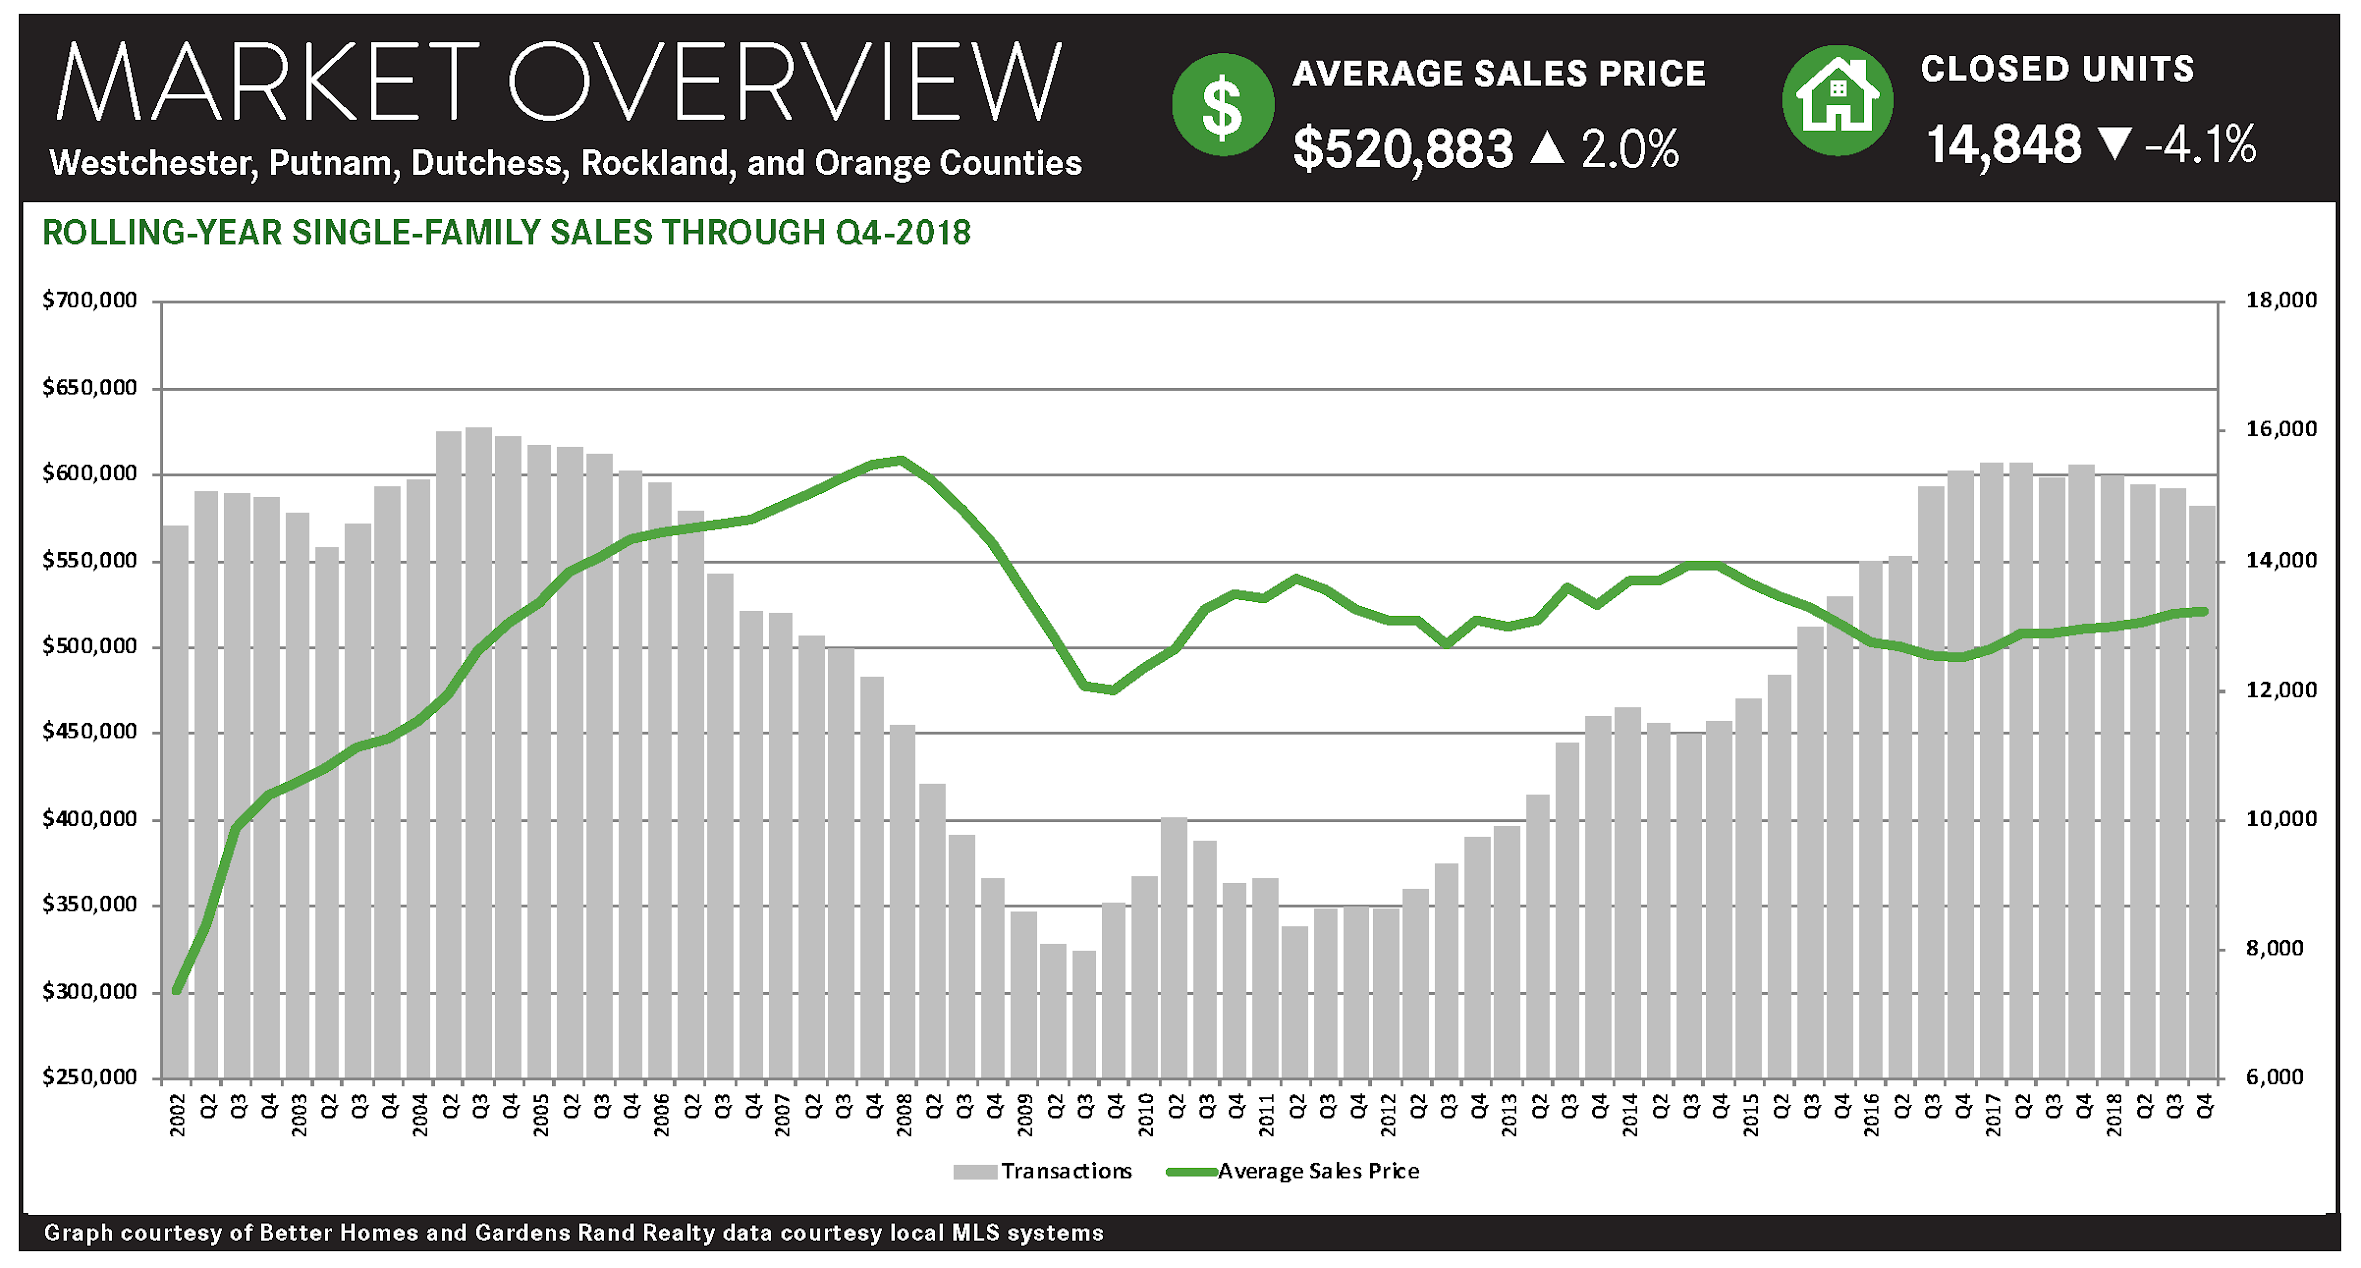
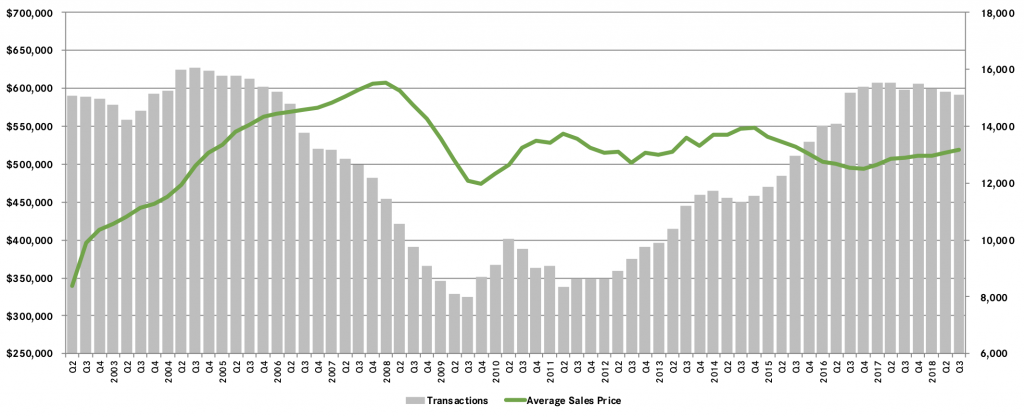
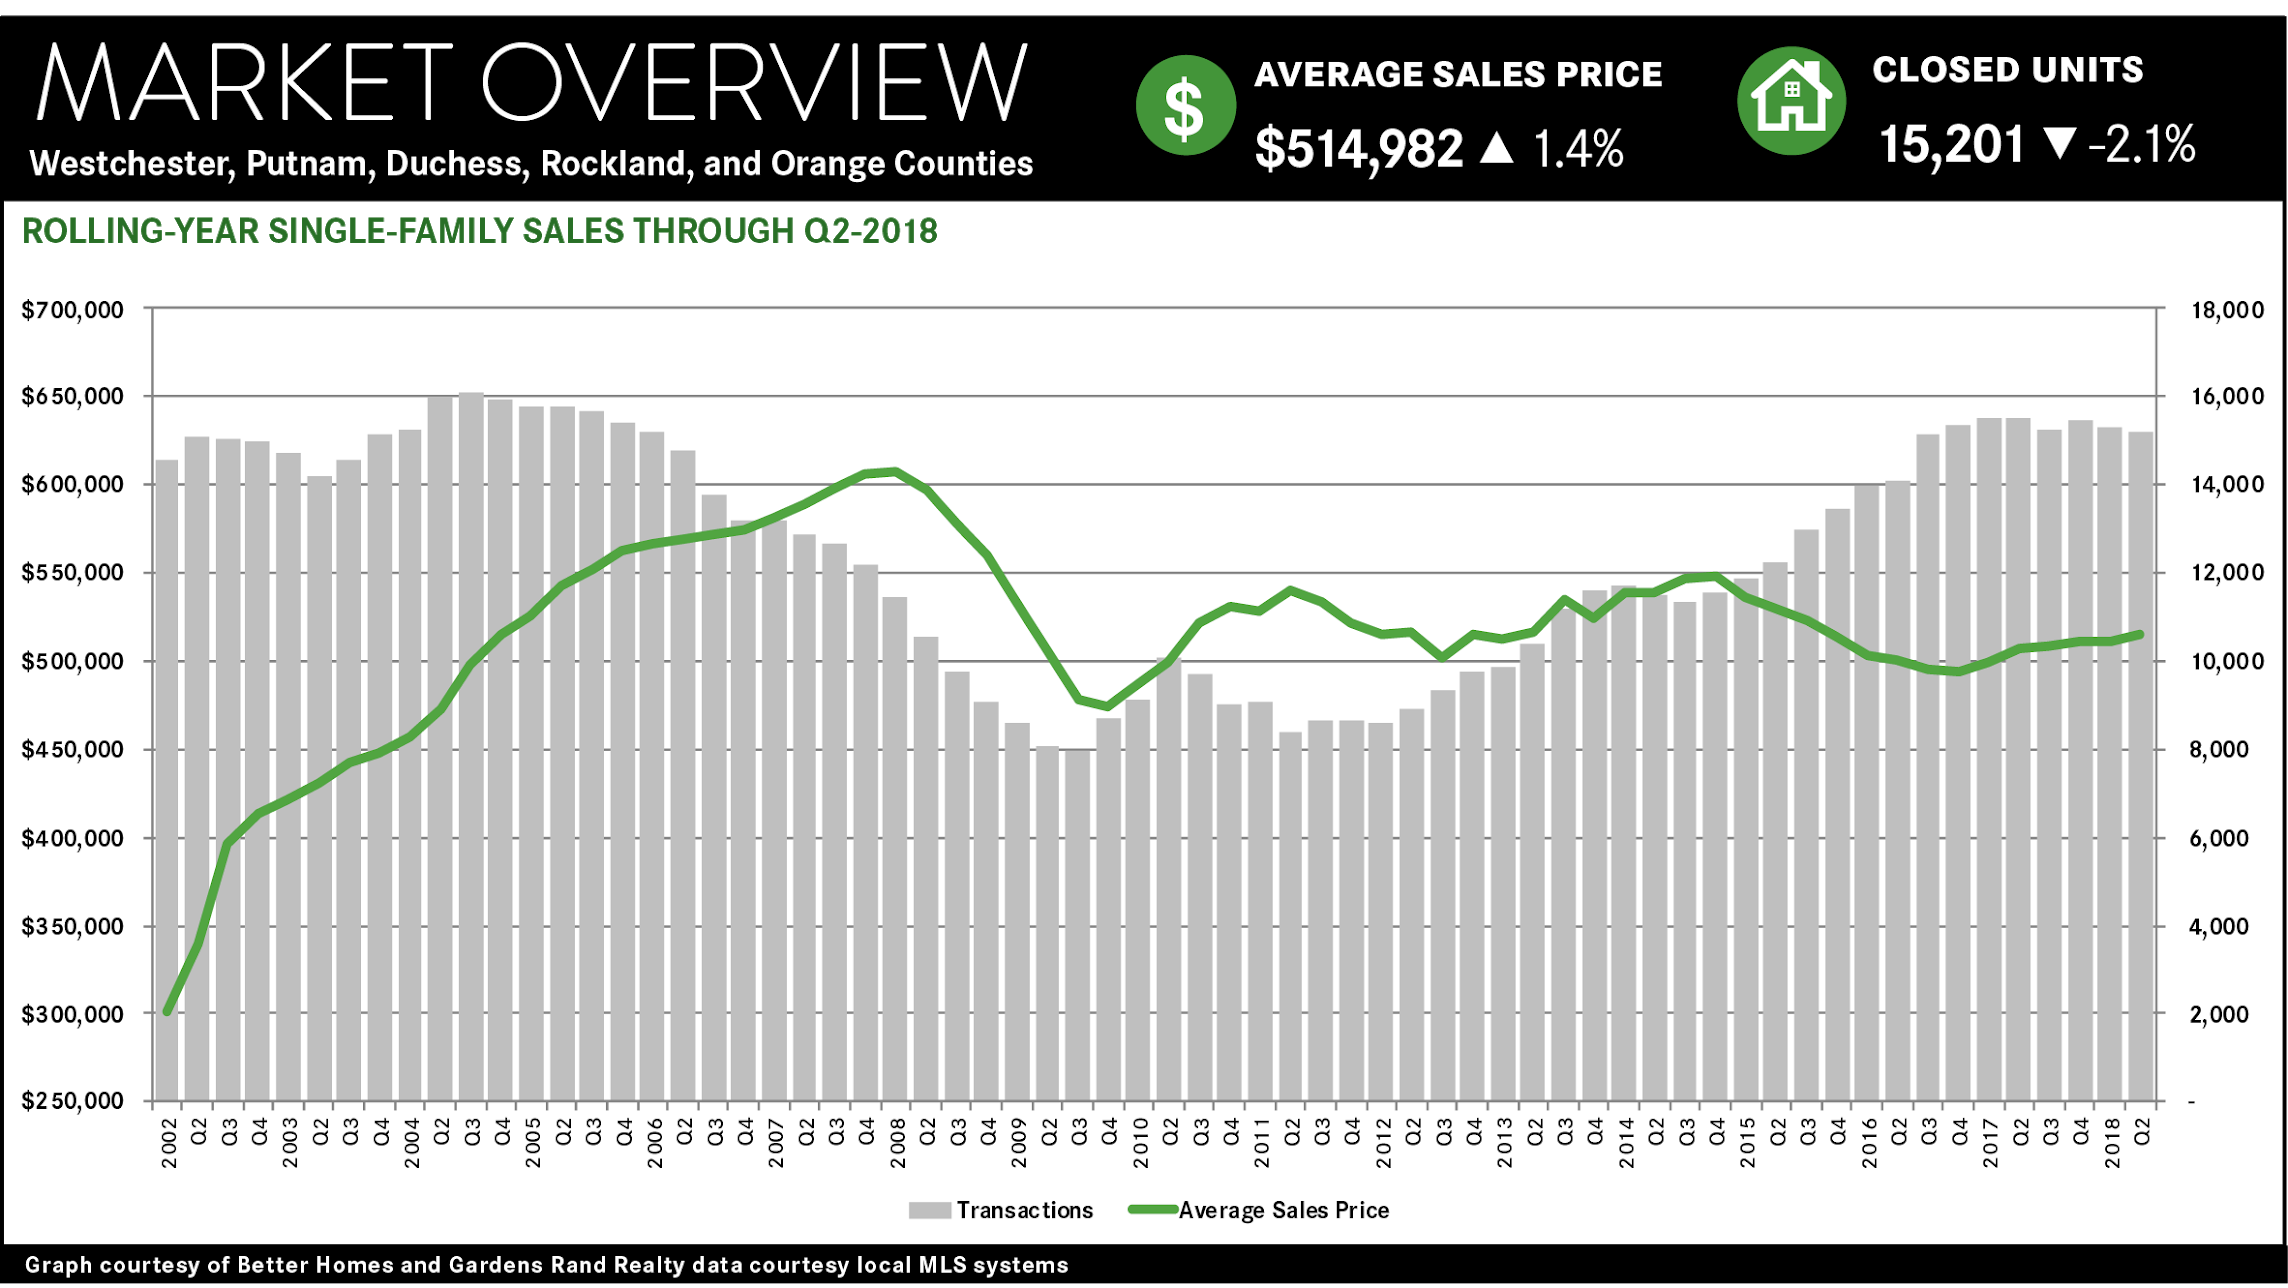
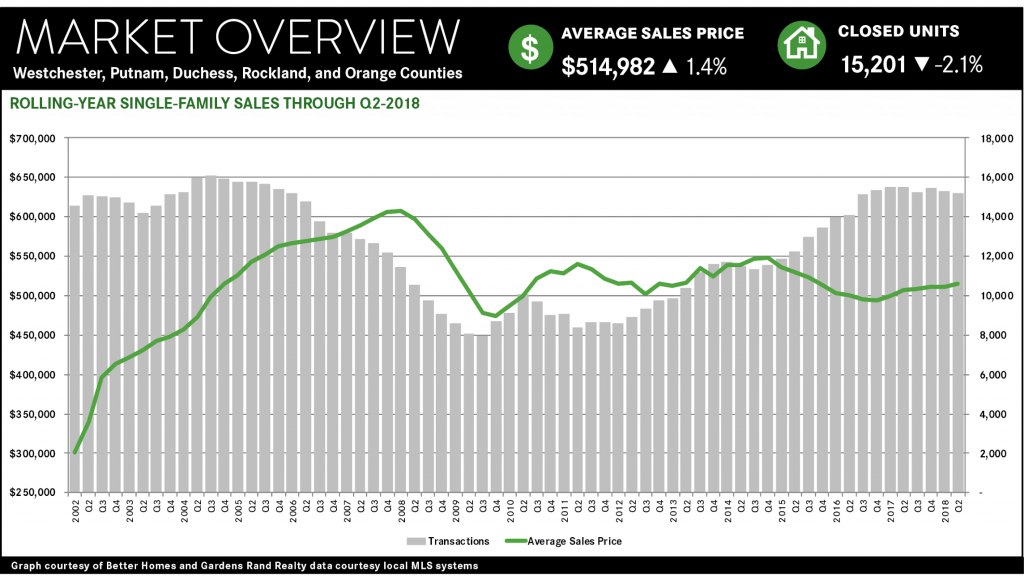
Sales in Westchester and the Hudson Valley housing markets were down throughout the region, even while high buyer demand, coupled with low levels of inventory, drove meaningful price appreciation in most of the regional markets.
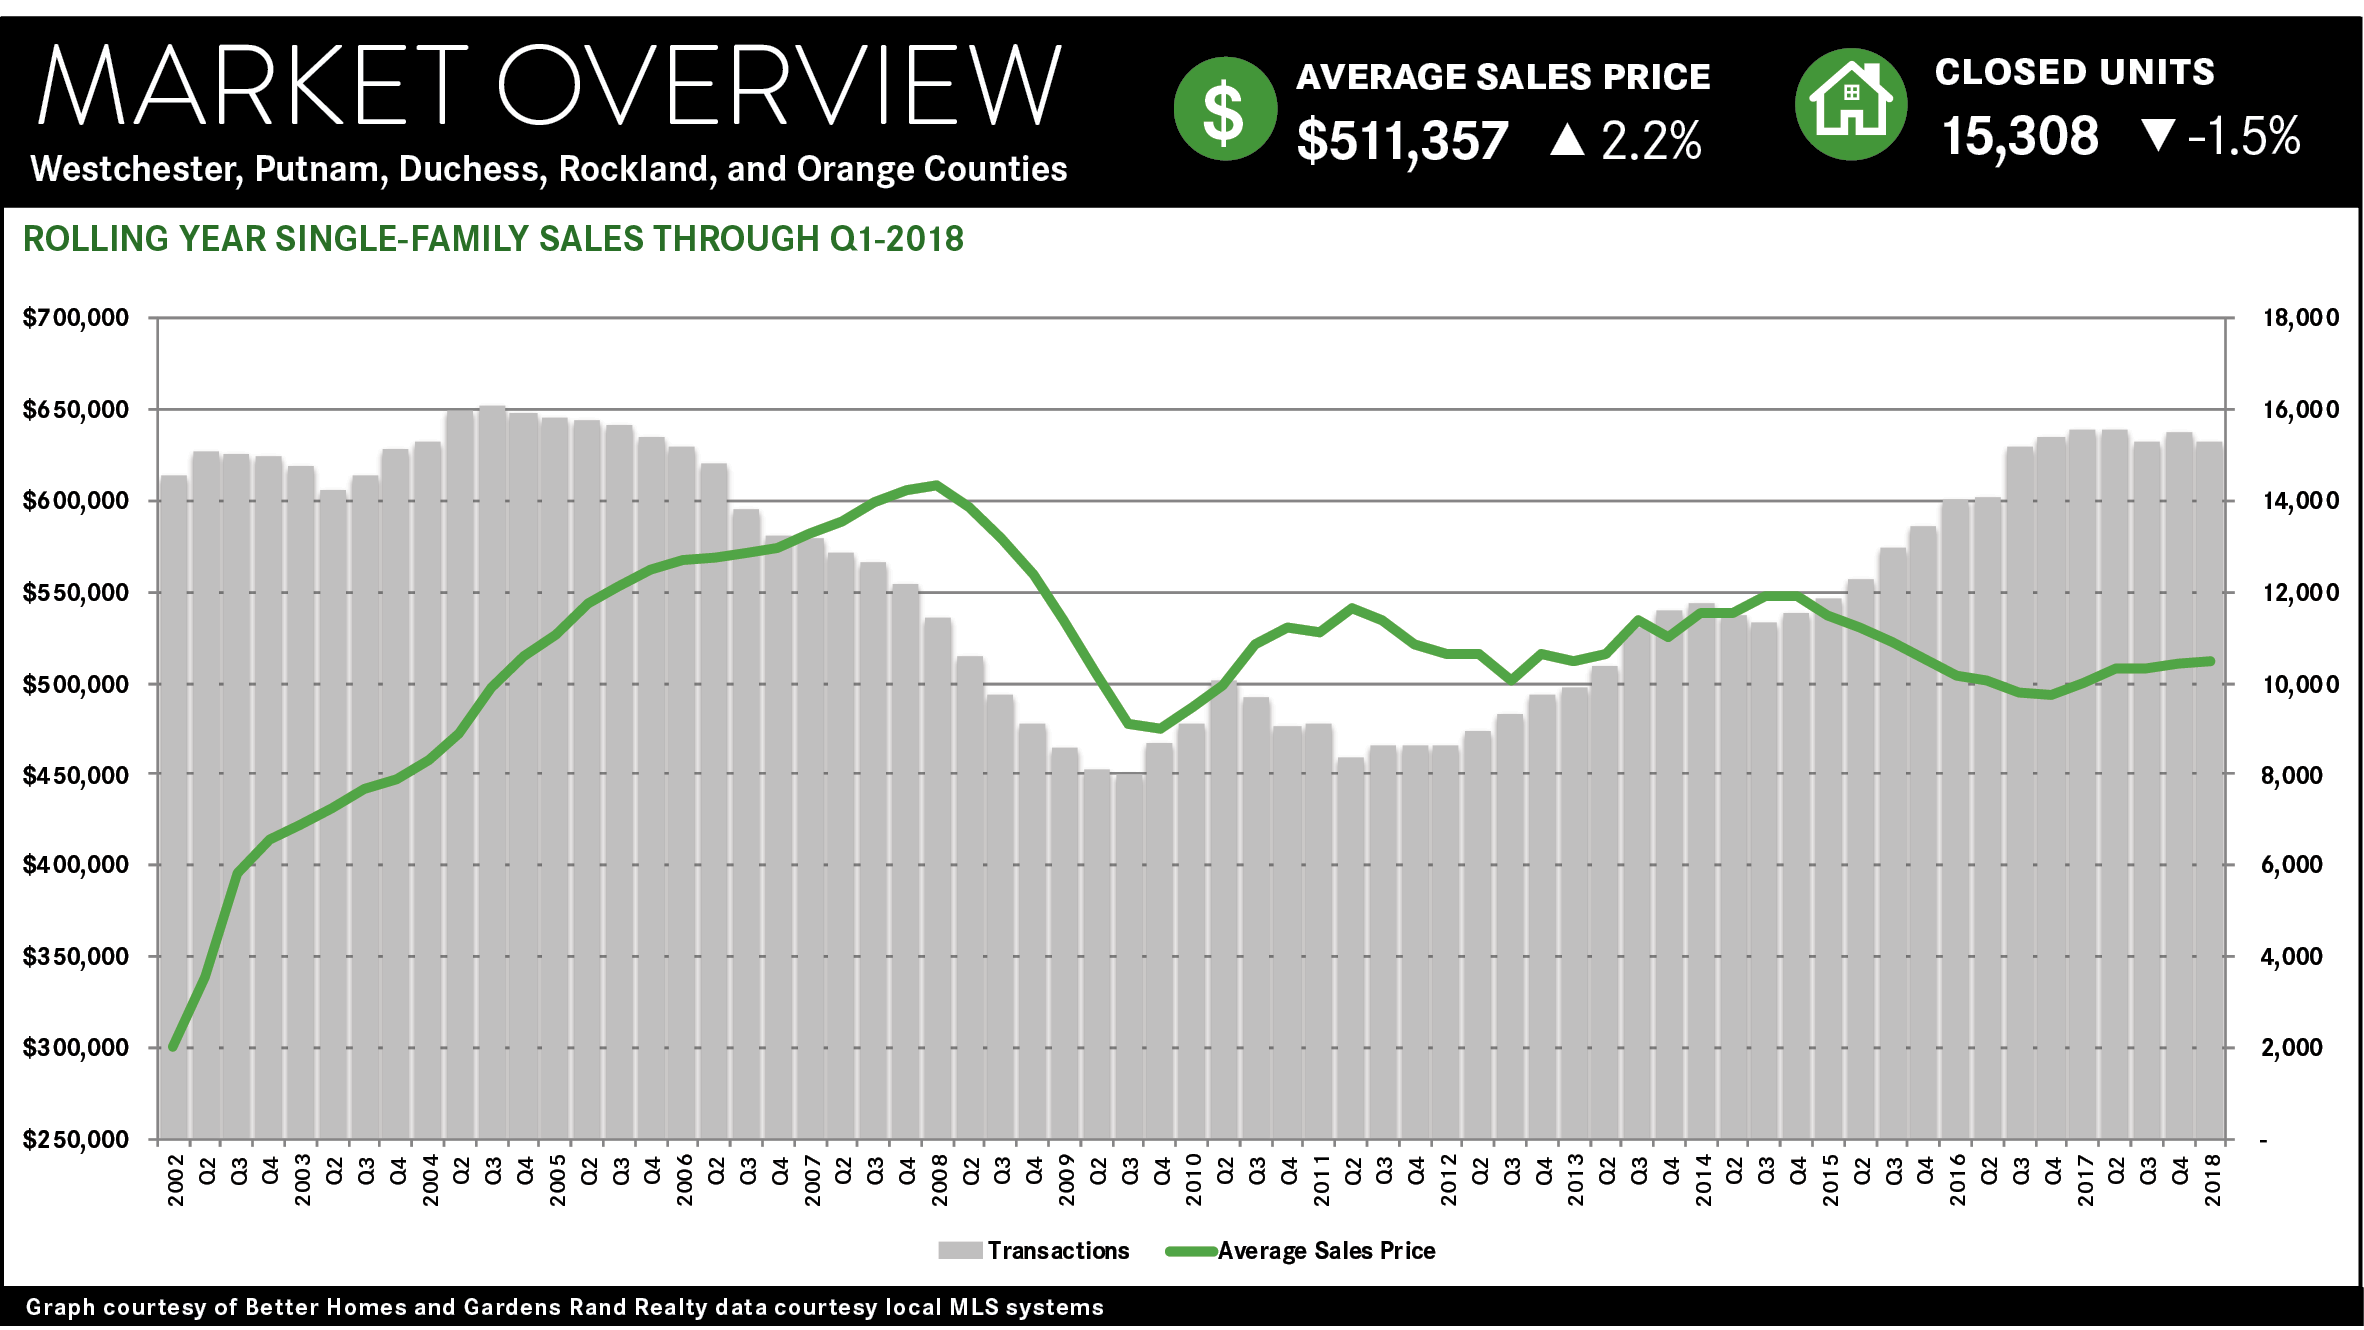
Sales were down throughout the region. Regional transactions fell across the board in the fourth quarter, dropping almost 7% for single‑family homes and 5% for condos. We saw the same story for the full 2018 year, with sales down over 4% for single‑family homes and about 1% for condos. To put these numbers in perspective, though, we closed almost 15,000 single‑family homes and almost 3,000 condos in 2018, up from about 9,000 single‑family homes and 2,000 condos back at the bottom of the market 10 years ago. So we’ve had a pretty good run‑up of sales in the past 10 years and were due to plateau at some point.
Prices were up in most of the markets of the region, particularly in the lower‑priced market segments.
Essentially, we had a “tale of two markets” developing in the region, with pricing flat only for the highest‑priced property type in the region – Westchester single‑family homes – even while average prices were up for every other county in the region for the year: up 6% in Putnam, 5% in Rockland, 9% in Orange, and 10% in Dutchess. And full‑year pricing in the entry‑level condo and coop markets was up in every market: rising 6% for Westchester coops, with condos up 0.1% in Westchester, 15% in Putnam, 1% in Rockland, 12% in Orange, and 7% in Dutchess.
So what was holding back pricing for Westchester single‑family homes? We might be seeing the effects of the 2018 Tax Reform, which capped deductions for state and local taxes, and could be having a disproportionate impact on high‑end buyers in high‑property‑tax Westchester. Unlike buyers in the entry‑level condo and coop market, or in the lower‑priced counties, Westchester luxury buyers are more likely to itemize their taxes, so they might be feeling the bite of the cap more acutely. This could be reducing demand at the higher‑ends of the market, suppressing the price appreciation we are seeing in the rest of the region.
Going forward, we believe that the market is still poised for growth. Sales are falling mostly due to a lack of supply, not a lack of demand. Essentially, the market needs more “fuel for the fire” – more viable inventory for the buyers who are looking. And that might be happening: regional single‑family home inventory was up almost 10% from last year, rising for the second quarter in a row after 25 straight quarters of year‑on‑year declines. This makes some economic sense, of course, since we would expect that sustained price appreciation over a period of time should tempt more homeowners into the market. The question is whether buyer demand is strong enough to continue driving price appreciation, even while absorbing this increased inventory. Ultimately, we believe that the region is still growing as a seller’s market, which should allow for both increases in sales and prices in what will be a robust spring market.
To learn more about Better Homes and Gardens Real Estate Rand Realty, visit their website and Facebook page, and make sure to “Like” their page. You can also follow them on Twitter, Pinterest, and Instagram.
Real Estate Market Report: Third Quarter 2018 – Dutchess County, NY
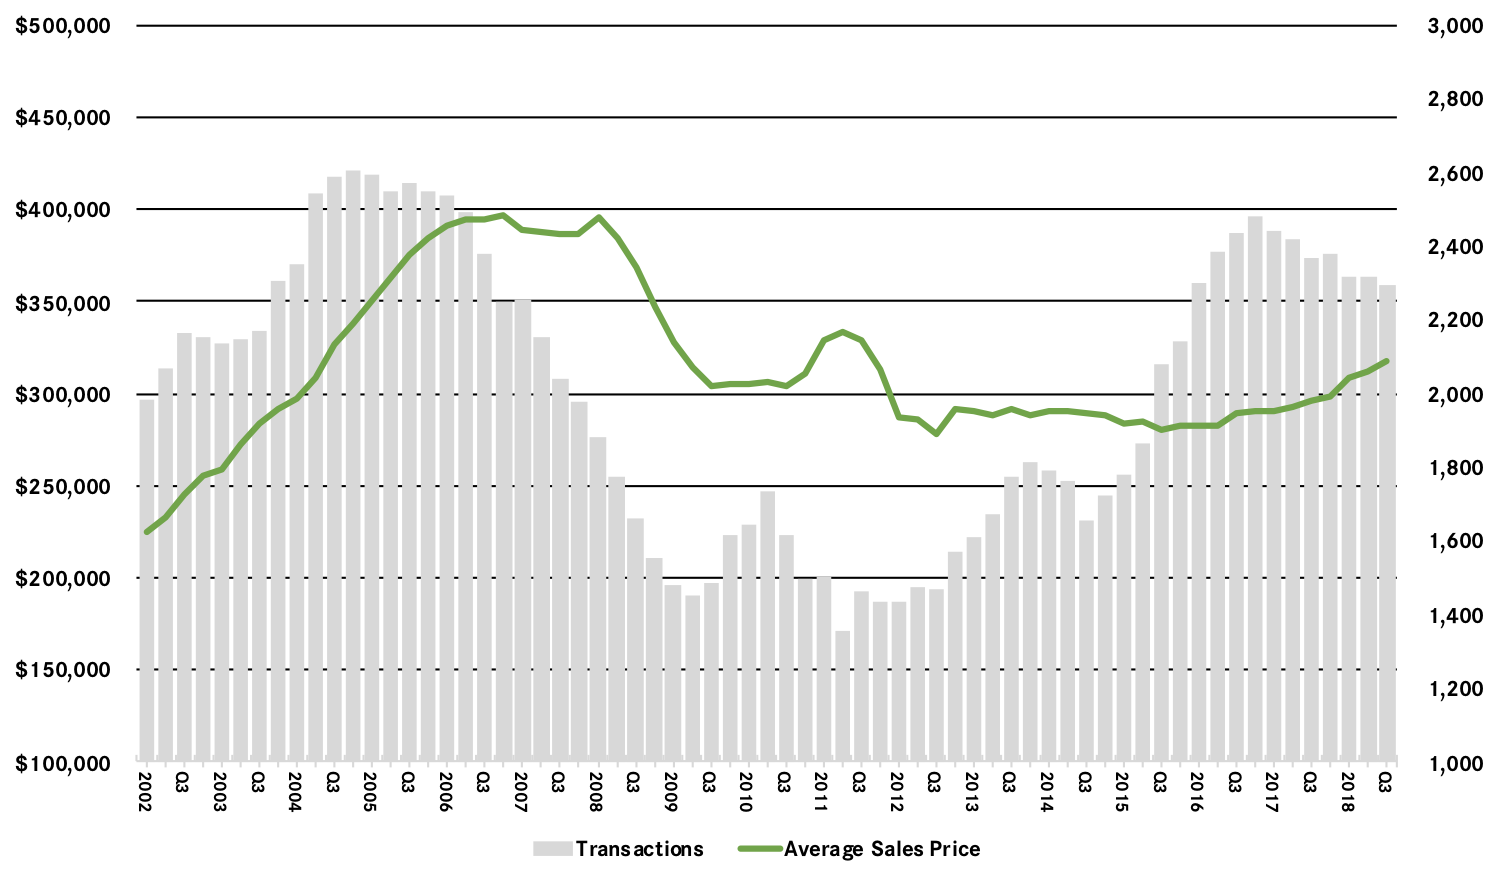
 Pricing in the Dutchess housing market soared again in the third quarter, with prices rising from high demand and limited inventory. Sales were down, just as in the rest of the region, from a lack of supply, not a lack of demand, which you can see from the pricing trends: Single‑family home prices rose almost 7% on average and 12% at the median for the quarter, finishing the rolling year up 7% on average and almost 10% at the median. And we saw the same results in the condo market, with prices leaping up 13% on average and almost 17% at the median. Those types of numbers are not sustainable, but even for the year, Dutchess condo prices are up meaningfully. Going forward, we expect these trends to continue, with stabilizing sales and rising prices through the end of the year and into 2019.
To learn more about Better Homes and Gardens Real Estate Rand Realty, visit their website and Facebook page, and make sure to “Like” their page. You can also follow them on Twitter, Pinterest, and Instagram.
Real Estate Market Report: Third Quarter 2018 – Westchester and Hudson Valley
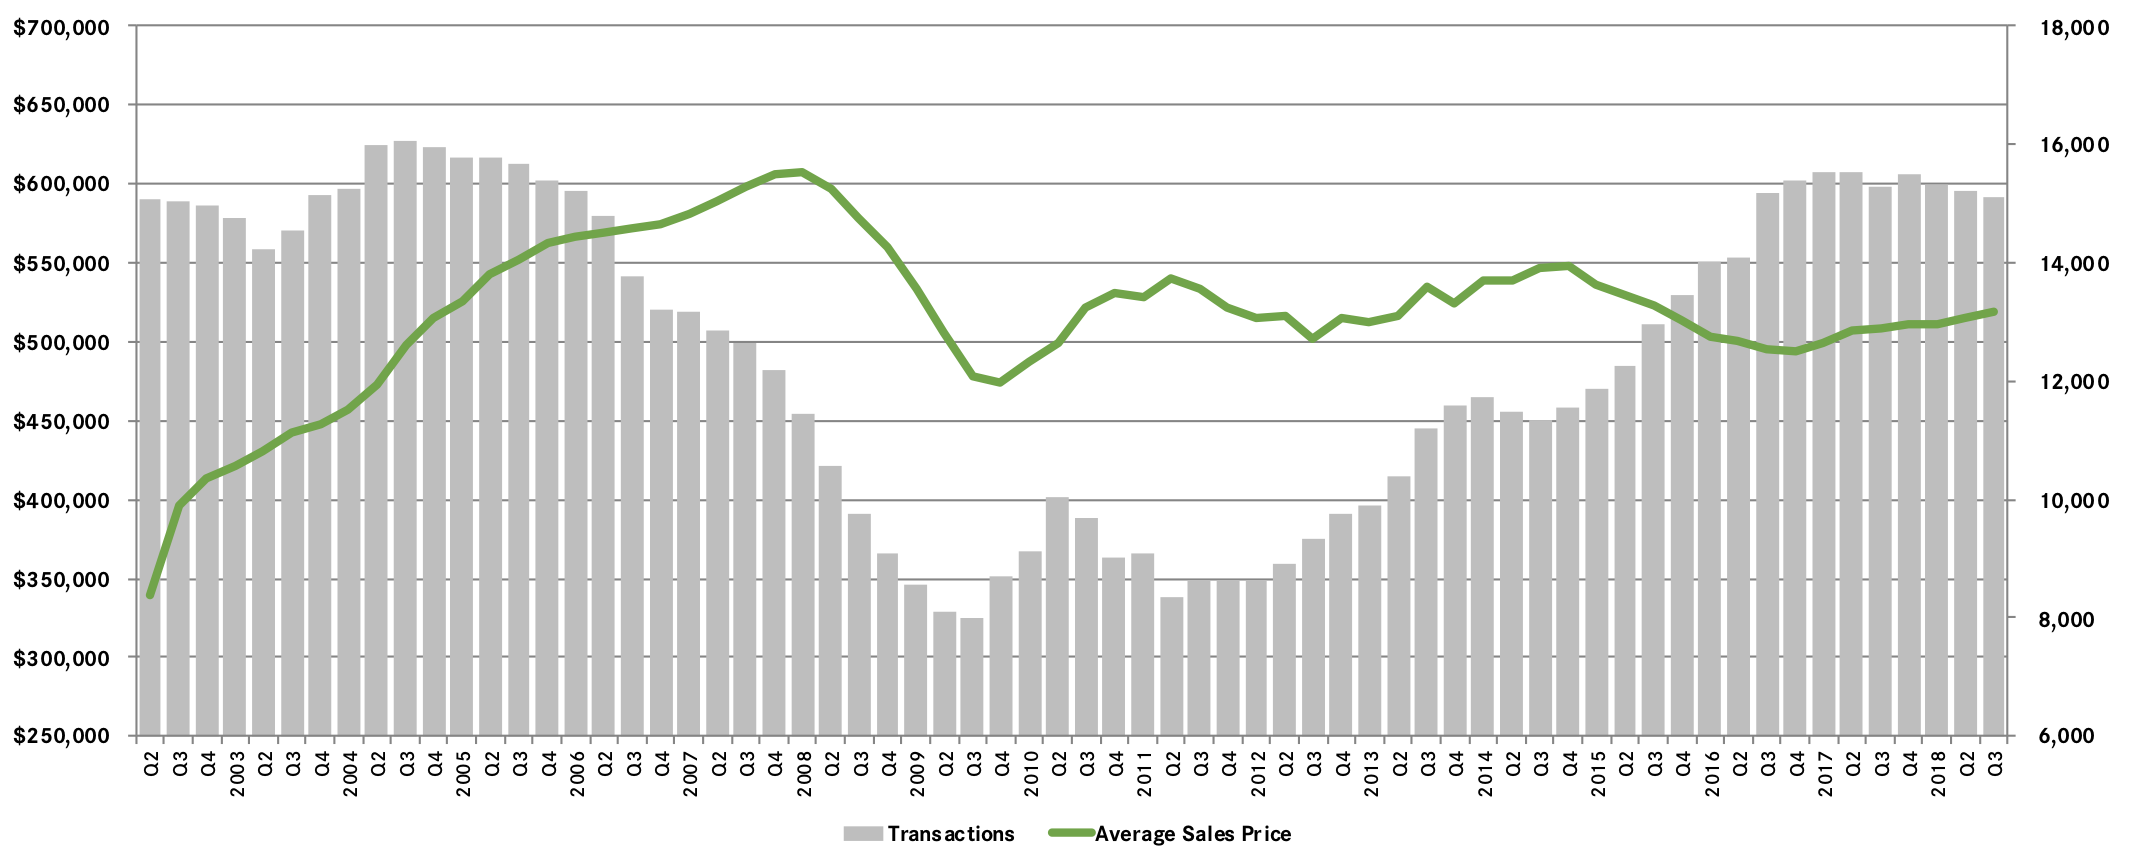
Despite concerns that the 2018 tax reform law would undermine housing values, Westchester and the Hudson Valley held steady in the third quarter, with prices rising throughout the region and up dramatically in some counties.
Some analysts have expressed concerns about the effects of the 2018 Tax Reform law on our regional housing market. The tax law capped the deductibility of state and local taxes and reduced the mortgage interest deduction, which particularly impacts high‑tax areas, like Westchester and the Hudson Valley. Indeed, those analysts might see evidence for this theory in the third-quarter results, with regional single‑family home sales falling almost 2% from last year, and down in almost every individual county.
For the most part, though, sales are down because of a lack of supply, not a lack of demand. Regional inventory levels have gone down 25 straight quarters, falling from a high of around 16 months to the current six months. Quarter after quarter, inventory went down until we reached a point where we have a shortage of desirable homes for sale. That’s what’s holding back sales – a lack of “fuel for the fire.”
How do we know that falling sales aren’t the result of slackening demand from the impact of tax reform? A couple of reasons:
First, this trend of declining sales predates tax reform. We’ve been tracking falling sales for almost two years, with regional sales down, in five out of the last six quarters, well before the passage of tax reform in late 2017.
Second, sales are down in all markets, not just high‑priced markets. Tax reform would not explain why sales are down even in the lower‑priced markets, where most buyers do not itemize taxes in a way that they’d be affected by changes in deductibility. And yet, quarterly sales were down more in Rockland and Dutchess than they were in Westchester.
Third, prices are up in almost every market segment. Regional average sales prices were up almost 3% for houses and 5% for condos in the third quarter and were up (in some cases dramatically) in every individual county for almost every property type. If tax reform had sapped demand in the market, we’d be seeing flat or declining pricing, not robust appreciation.
All that said, tax reform might be having a small impact on the very high end of the market, where the loss of deductibility for mortgage interest and local taxes hits the hardest. Price appreciation was more pronounced in the lower‑priced markets, with single‑family average prices rising 11% in Putnam, 6% in Rockland, 14% in Orange, and 7% in Dutchess. Meanwhile, Westchester’s single‑family home pricing was up just a tick on average, and only fell 1% at the median. We’re talking about a marginal, not a major, impact. Prices aren’t rising at the rate they are in the lower‑priced markets, they’re basically flat, not falling.
Moreover, inventory is starting to respond to these rising prices. For the first time since 2012, inventory levels went up this quarter, which illustrates fundamental economic market theory: If demand is strong, and supply stays steady (or goes down), prices will go up. And when prices go up, new inventory will come onto the market. That’s what we’re seeing now: After years of decline, single‑family inventory was up in almost every county in the region, stabilizing near that six‑month level that usually signals a balancing market.
Going forward, we believe that the appetite in the market can handle both the impact of tax reform and this increased inventory while still driving continued price appreciation. With strong economic conditions, relatively low‑interest rates (and the specter of rate increases on the horizon), and pricing still at attractive 2004‑05 levels, we expect a robust market through the end of the year.
To learn more about Better Homes and Gardens Real Estate Rand Realty, visit their website and Facebook page, and make sure to “Like” their page. You can also follow them on Twitter, Pinterest, and Instagram.
Real Estate Market Report: 2nd Quarter 2018 – Dutchess County, NY

 Pricing in the Dutchess housing market spiked in the second quarter, as low levels of inventory, coupled with high demand, drove prices up. Single‑family home prices rose over 10% on average and 8% at the median for the quarter, with both the average and median now up over 6% for the year. The condo market is a little more mixed, but the overall story is that Dutchess demand is still high, inventory is still low, and as a result, we’re seeing significant pressure on pricing. Going forward, we expect these trends to continue, with stabilizing sales and rising prices through a robust summer and the end of the year.
To learn more about Better Homes and Gardens Real Estate Rand Realty, visit their website and Facebook page, and make sure to “Like” their page. You can also follow them on Twitter, Pinterest, and Instagram.
Real Estate Market Report: 2nd Quarter 2018 – Lower Hudson Valley (New York)
 The regional housing market in the New York City northern suburbs surged again in the second quarter of 2018, with high demand and low supply driving prices up throughout the area.
We are clearly in a “seller’s market.” The main story in the market right now is a textbook illustration of basic economic principles: when demand is high, and supply is low, prices go up. This is essentially what a seller’s market looks like, with low levels of inventory coupled with high demand holding sales down while driving prices up. And that’s exactly what we’re seeing throughout the region:
Sales are down. Regional single‑family home sales in the quarter fell almost 3%, and condo sales fell 7%, continuing a trend we’ve been watching for the past year ‑‑ indeed, the rolling-year sales were down about 2% for all property types. To put this in perspective, rolling-year sales had gone up in 24 out of the last 25 quarters prior to the first quarter of this year. And the decline is universal, with single‑family sales down in virtually every county in the region: falling almost 5% in Westchester, 4% in Putnam, and 10% in Rockland (sales rose slightly in Orange and Dutchess).
Prices are up. But all this demand, coupled with a lack of supply, is having its expected impact on pricing. Single‑family average prices were up across the board, rising over 3% for the region and up in every county in the region: up over 2% in Westchester, almost 3% in Putnam, over 8% in Rockland, almost 11% in Orange, and over 10% in Dutchess. And for the first time in over 10 years, single‑family average prices for the rolling year were up in every county in the region.
Inventory is low, but is starting to rise. The key to this market, of course, is the amount of available supply: the number of homes for sale in the market. Inventory has been falling for several years now, holding back sales and driving prices up. But that same economics textbook teaches us that as prices go up, eventually supply starts to rise. Why? Because rising prices attract sellers into the market.
And that is exactly what we’re starting to see: stabilizing inventory. Inventory is still low, but it’s starting to settle at about the six‑month level that signals a balanced market. Indeed, the months of inventory in the region was at 6.2 months, flat compared to the second quarter of last year. And inventory was actually up in both Westchester and Rockland. It might be too early to call a shift in the market, but this was a noticeable change after several years of sharp inventory declines quarter after quarter.
Going forward, we expect the market to continue to grow through 2018. The seller’s market is really just starting to hit its stride, where high demand meets higher supply and pushes both sales and prices up over last year. Higher prices might be tempting more sellers into the market, but we believe that demand is strong enough to accommodate this supply, and drive price appreciation through the end of the year.
To learn more about Better Homes and Gardens Real Estate Rand Realty, visit their website and Facebook page, and make sure to “Like” their page. You can also follow them on Twitter, Pinterest, and Instagram.
Real Estate Market Report: 1st Quarter 2018 – Dutchess County, NY
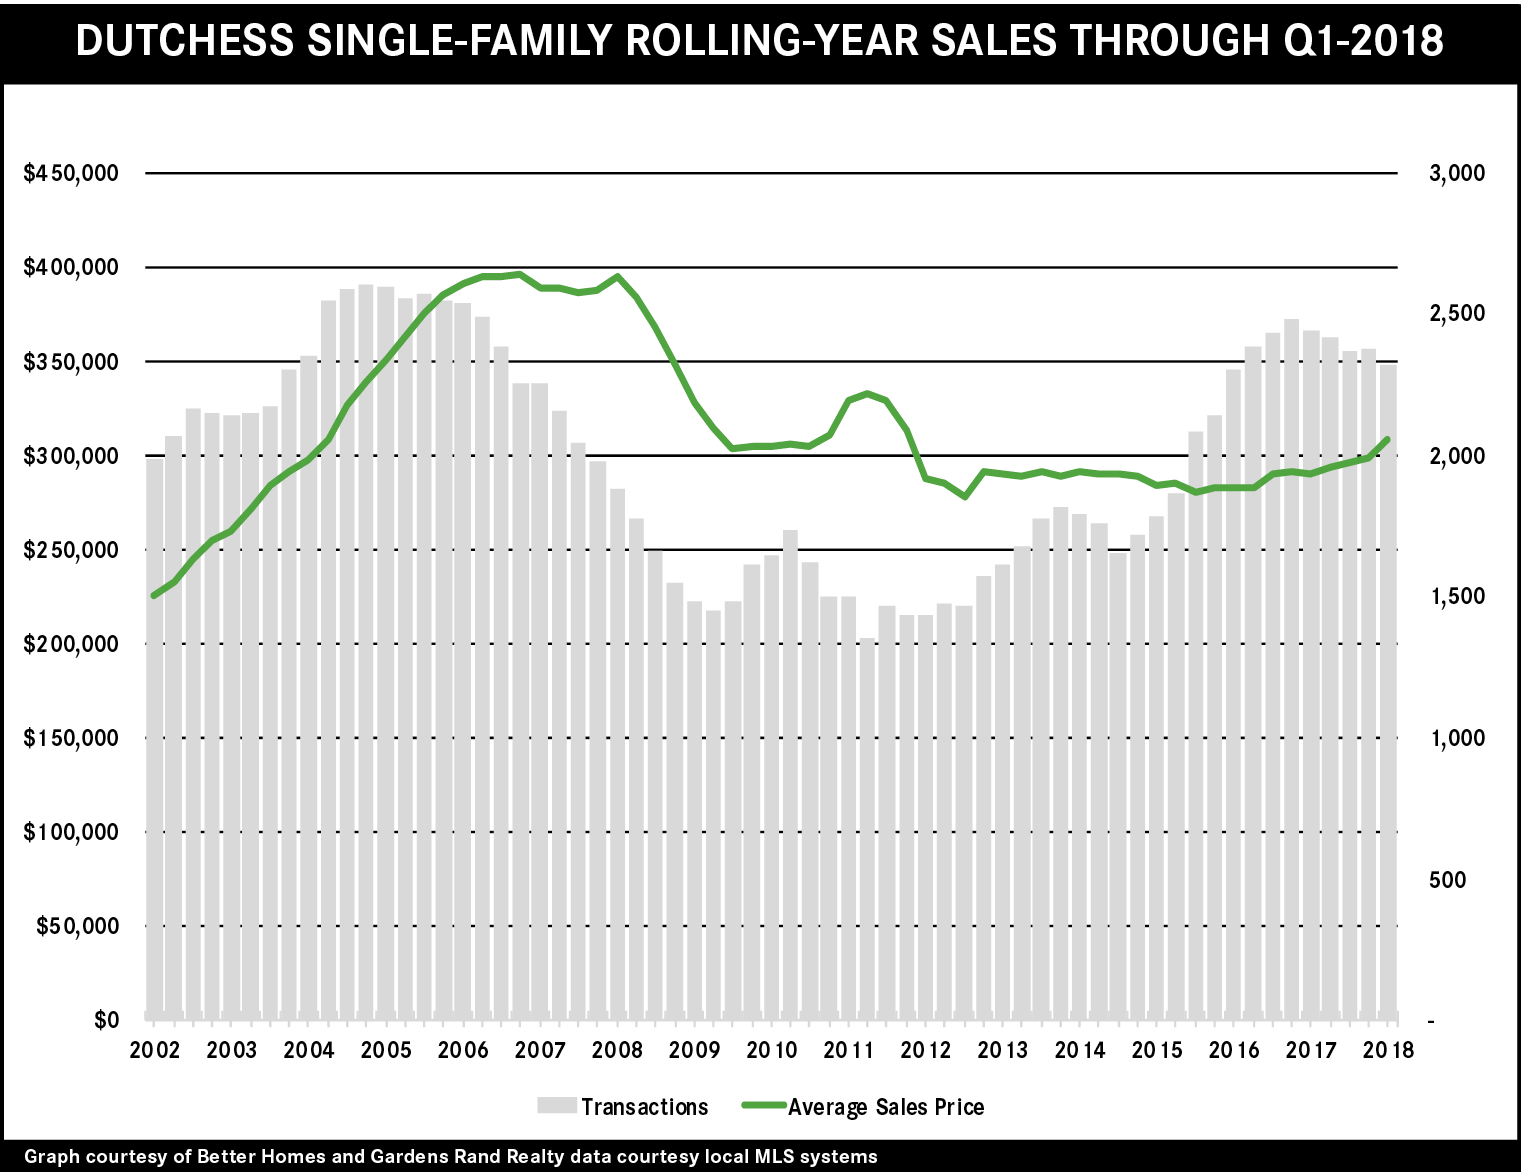
 Dutchess single‑family home sales were down sharply in the first quarter, a consequence of a lack of inventory unable to meet strong demand. That’s why prices were up dramatically, rising over 10% for single‑family and almost 18% for condos. This kind of appreciation is probably not sustainable, but the yearlong numbers are also good, with average prices up almost 5% for single‑family and over 2% for condos. We expect that this pricing will eventually attract more sellers into what will be a robust spring market.
To learn more about Better Homes and Gardens Real Estate Rand Realty, visit their website and Facebook page, and make sure to “Like” their page. You can also follow them on Twitter, Pinterest, and Instagram.
Real Estate Market Report: 1st Quarter 2018 – Lower Hudson Valley (NY)
 The housing market in the New York City northern suburbs of Westchester and the Hudson Valley has become a fully‑realized seller’s market, with declining inventory stifling sales growth while driving meaningful price appreciation throughout the region.
The regional market continues to suffer from a lack of inventory. The number of homes available for sale compared to last year fell sharply in every market in the region. At the current absorption rate, we are now down to well under five months of inventory in every county for single‑family homes, and down to under four months for the lower‑priced condo market. That’s significantly below the six‑month level that usually denotes a seller’s market.
This lack of inventory is holding back sales. Regional transactions were down over 6% from last year’s first quarter, and were down in every county except Putnam: falling 6% in Westchester, 19% in Rockland, 0.3% in Orange, and 13% in Dutchess. For the rolling year, the drop was more moderate, with sales down just 1.5% regionally. But this isn’t a demand problem—demand is strong everywhere in the region.
But with all this demand chasing fewer homes, prices are up significantly across the region. The average sales price was up for every county and property type except for Westchester single‑family homes and condos, which might be a reflection of stronger demand at more entry‑level price points. The longer‑term trend, though, indicates that prices are generally appreciating at a moderate but meaningful rate, with the rolling-year average sales price for single‑family homes up over 2% for the region, and up in each county: rising 3% in Westchester, 5% in Putnam, 4% in Rockland, 4% in Orange, and 5% in Dutchess.
Going forward, this is what a seller’s market looks like. Low levels of inventory will continue to hold sales back even while driving prices up. At some point in 2018, this price appreciation will attract more sellers into the market, which will increase supply, bring sales up, and maybe moderate price increases. But that will not happen right away, so we expect a spring market with even lower levels of inventory, which will stifle sales growth but continue to drive robust price appreciation.
To learn more about Better Homes and Gardens Real Estate Rand Realty, visit their website and Facebook page, and make sure to “Like” their page. You can also follow them on Twitter, Pinterest, and Instagram.
Fourth Quarter 2017 Real Estate Market Report: Dutchess County Overview
 The Dutchess County housing market finished the year strong, with the first clear signs of meaningful price appreciation in years.
Sales. Dutchess sales rose slightly in the fourth quarter, up just about 1%. For the year, sales were down over 4%, which reflects low levels of inventory more than a lack of demand. Dutchess definitely needs more listings, some “fuel for the fire” to accommodate strong buyer demand.
Prices. Home prices continued to show the effects of declining inventory coupled with strong demand, with pricing up almost 3% on average, almost 8% at the median, and almost 3% in the price‑per‑square foot. For the calendar year, Dutchess experienced meaningful price appreciation, with the average up almost 3%, the median rising 4%, and the price‑per‑square‑foot up over 3%. Average prices in Dutchess have now gone up for two straight years, following four straight years of declines, where prices were bouncing around the bottom.
Negotiability. Dutchess homes are continuing to sell more quickly and for closer to the asking price, reflecting the negotiating leverage that sellers are getting in this market.
Condos. The condo market was mostly down for the quarter and flat for the year. In the fourth quarter, sales were down over 7%, and prices were down over 6% on average and almost 5% at the median. For the year, sales and prices were mostly flat, but the negotiability indicators signaled that Dutchess condos were moving into a seller’s market.
Going forward, we believe that the Dutchess market will experience a robust 2018. With tightening inventory, a stable economy, near‑historically‑low interest rates, and homes still priced at appealing 2003‑04 levels, Dutchess is likely to see meaningful price appreciation throughout the year.
To learn more about Better Homes and Gardens Real Estate Rand Realty, visit their website and Facebook page, and make sure to “Like” their page. You can also follow them on Twitter.
Fourth Quarter 2017 Real Estate Market Report: Westchester & Hudson Valley Market Overview
 The housing market in Westchester and the Hudson Valley finished the year strong in the fourth quarter of 2017, with meaningful price appreciation throughout the region driven by low inventory and high demand. Although sales have slumped a bit due to the lack of available homes for sale, rising prices might tempt new sellers to come into this growing seller’s market.
Inventory throughout the region continues to fall. Regional inventory was down to 4.6 months. Historically, when inventory drops below the six month level, it usually signals a seller’s market, and many of the individual counties in the region are now at‑or‑below six‑months’ worth of inventory: Westchester single‑family homes are now at 3.5, Putnam at 4.7, Rockland at 4.0, and Orange at 4.7. The lack of inventory continues to stifle sales growth. Regional sales were up for the first time in three quarters, rising almost 6% from the fourth quarter of last year. For all of 2017, sales were up less than 1%, the lowest year‑on‑year increase since 2011. But the problem isn’t lack of buyer demand, which remains strong. Rather, it’s simply that we don’t have enough homes for sale to satisfy the existing demand. Even with the lack of inventory, sales are approaching record highs. The 15,489 regional single‑family home sales in 2017 marked the highest yearly total since 2004, at the height of the last seller’s market. Indeed, sales totals are now almost doubling what we saw at the bottom of the market in 2009. Most significantly, high demand and low inventory are driving meaningful price appreciation. The regional average sales price was up for the fourth quarter in a row, rising almost 3%. We are starting to see long‑term price appreciation, with the regional average price also up 3% for the year. Moreover, appreciation was widespread, with yearlong average prices up in every county in the region: 4% in Westchester, 2% in Putnam, 4% in Rockland, 5% in Orange, and 3% in Dutchess. This is the first time we’ve seen such shared prosperity in over 10 years. Going forward, we believe that prices will continue to appreciate through 2018. Demand is strong, bolstered by near‑historically‑low interest rates, prices that are still near 2003‑04 levels (without controlling for inflation), a generally strong economy, and sharply declining inventory. The question is if we will see sales growth, which will depend on whether homeowners see prices going up and decide to get into this market, bringing fresh new listings to satiate the existing buyer demand. All in all, this is what a seller’s market looks like. High sales totals. Low inventory. Rising prices. All the signs point to an extremely robust 2018 throughout the region. WESTCHESTER
The Westchester housing market finished strong in 2017, with a surge in prices even while a lack of inventory held back sales growth.
Sales. Home sales were up just a tick, rebounding a bit from their sudden decline in the third quarter. You can see the continued impact of a lack of inventory, though, with sales down almost 2% for the full year. Still, with over 6,100 sales for the year, transactions in Westchester are now at their highest level since 2005, and almost double where they were at the bottom of the market in 2009.
Prices. With inventory this low, and demand remaining high, we are starting to see some acceleration in price appreciation. Prices were up 5% on average and at the median for the quarter, and for the year finished up 4% on average and 3% at the median. This is welcome news for Westchester homeowners, who saw small average and median price drops over the past two years. That said, the average and median price are still at 2005 levels, without even accounting for inflation.
Negotiability. The negotiability indicators continue to signal the emergence of the seller’s market. Inventory declined again, falling over 8% and now at the lowest level of inventory we have had in Westchester in over 12 years, since the height of the last seller’s market. Similarly, for the full year, the listing retention rate was up, and the days‑on‑market was down, indicating that homes are selling more quickly and for closer to the asking price.
Condos and Coops. The condo and coop market was more uneven. The condo market was sizzling, with average prices up over 8% in the quarter and almost 5% for the year. Sales were down, but that’s certainly because inventory is below the three‑month level. The coop market was more mixed, with sales up for the year and prices relatively flat, even while inventory fell to the three‑month level.
Going forward, we expect that Westchester will continue to see meaningful price appreciation in 2018, especially if inventory remains tight. With pricing near 2005 levels and interest rates near historic lows, we believe that the seller’s market will thrive in the new year.
To learn more about Better Homes and Gardens Real Estate Rand Realty, visit their website and Facebook page, and make sure to “Like” their page. You can also follow them on Twitter.


