
 Facebook
 X
X
 Pinterest
 Copy Link
Fourth Quarter 2017 Real Estate Market Report: Putnam County Overview
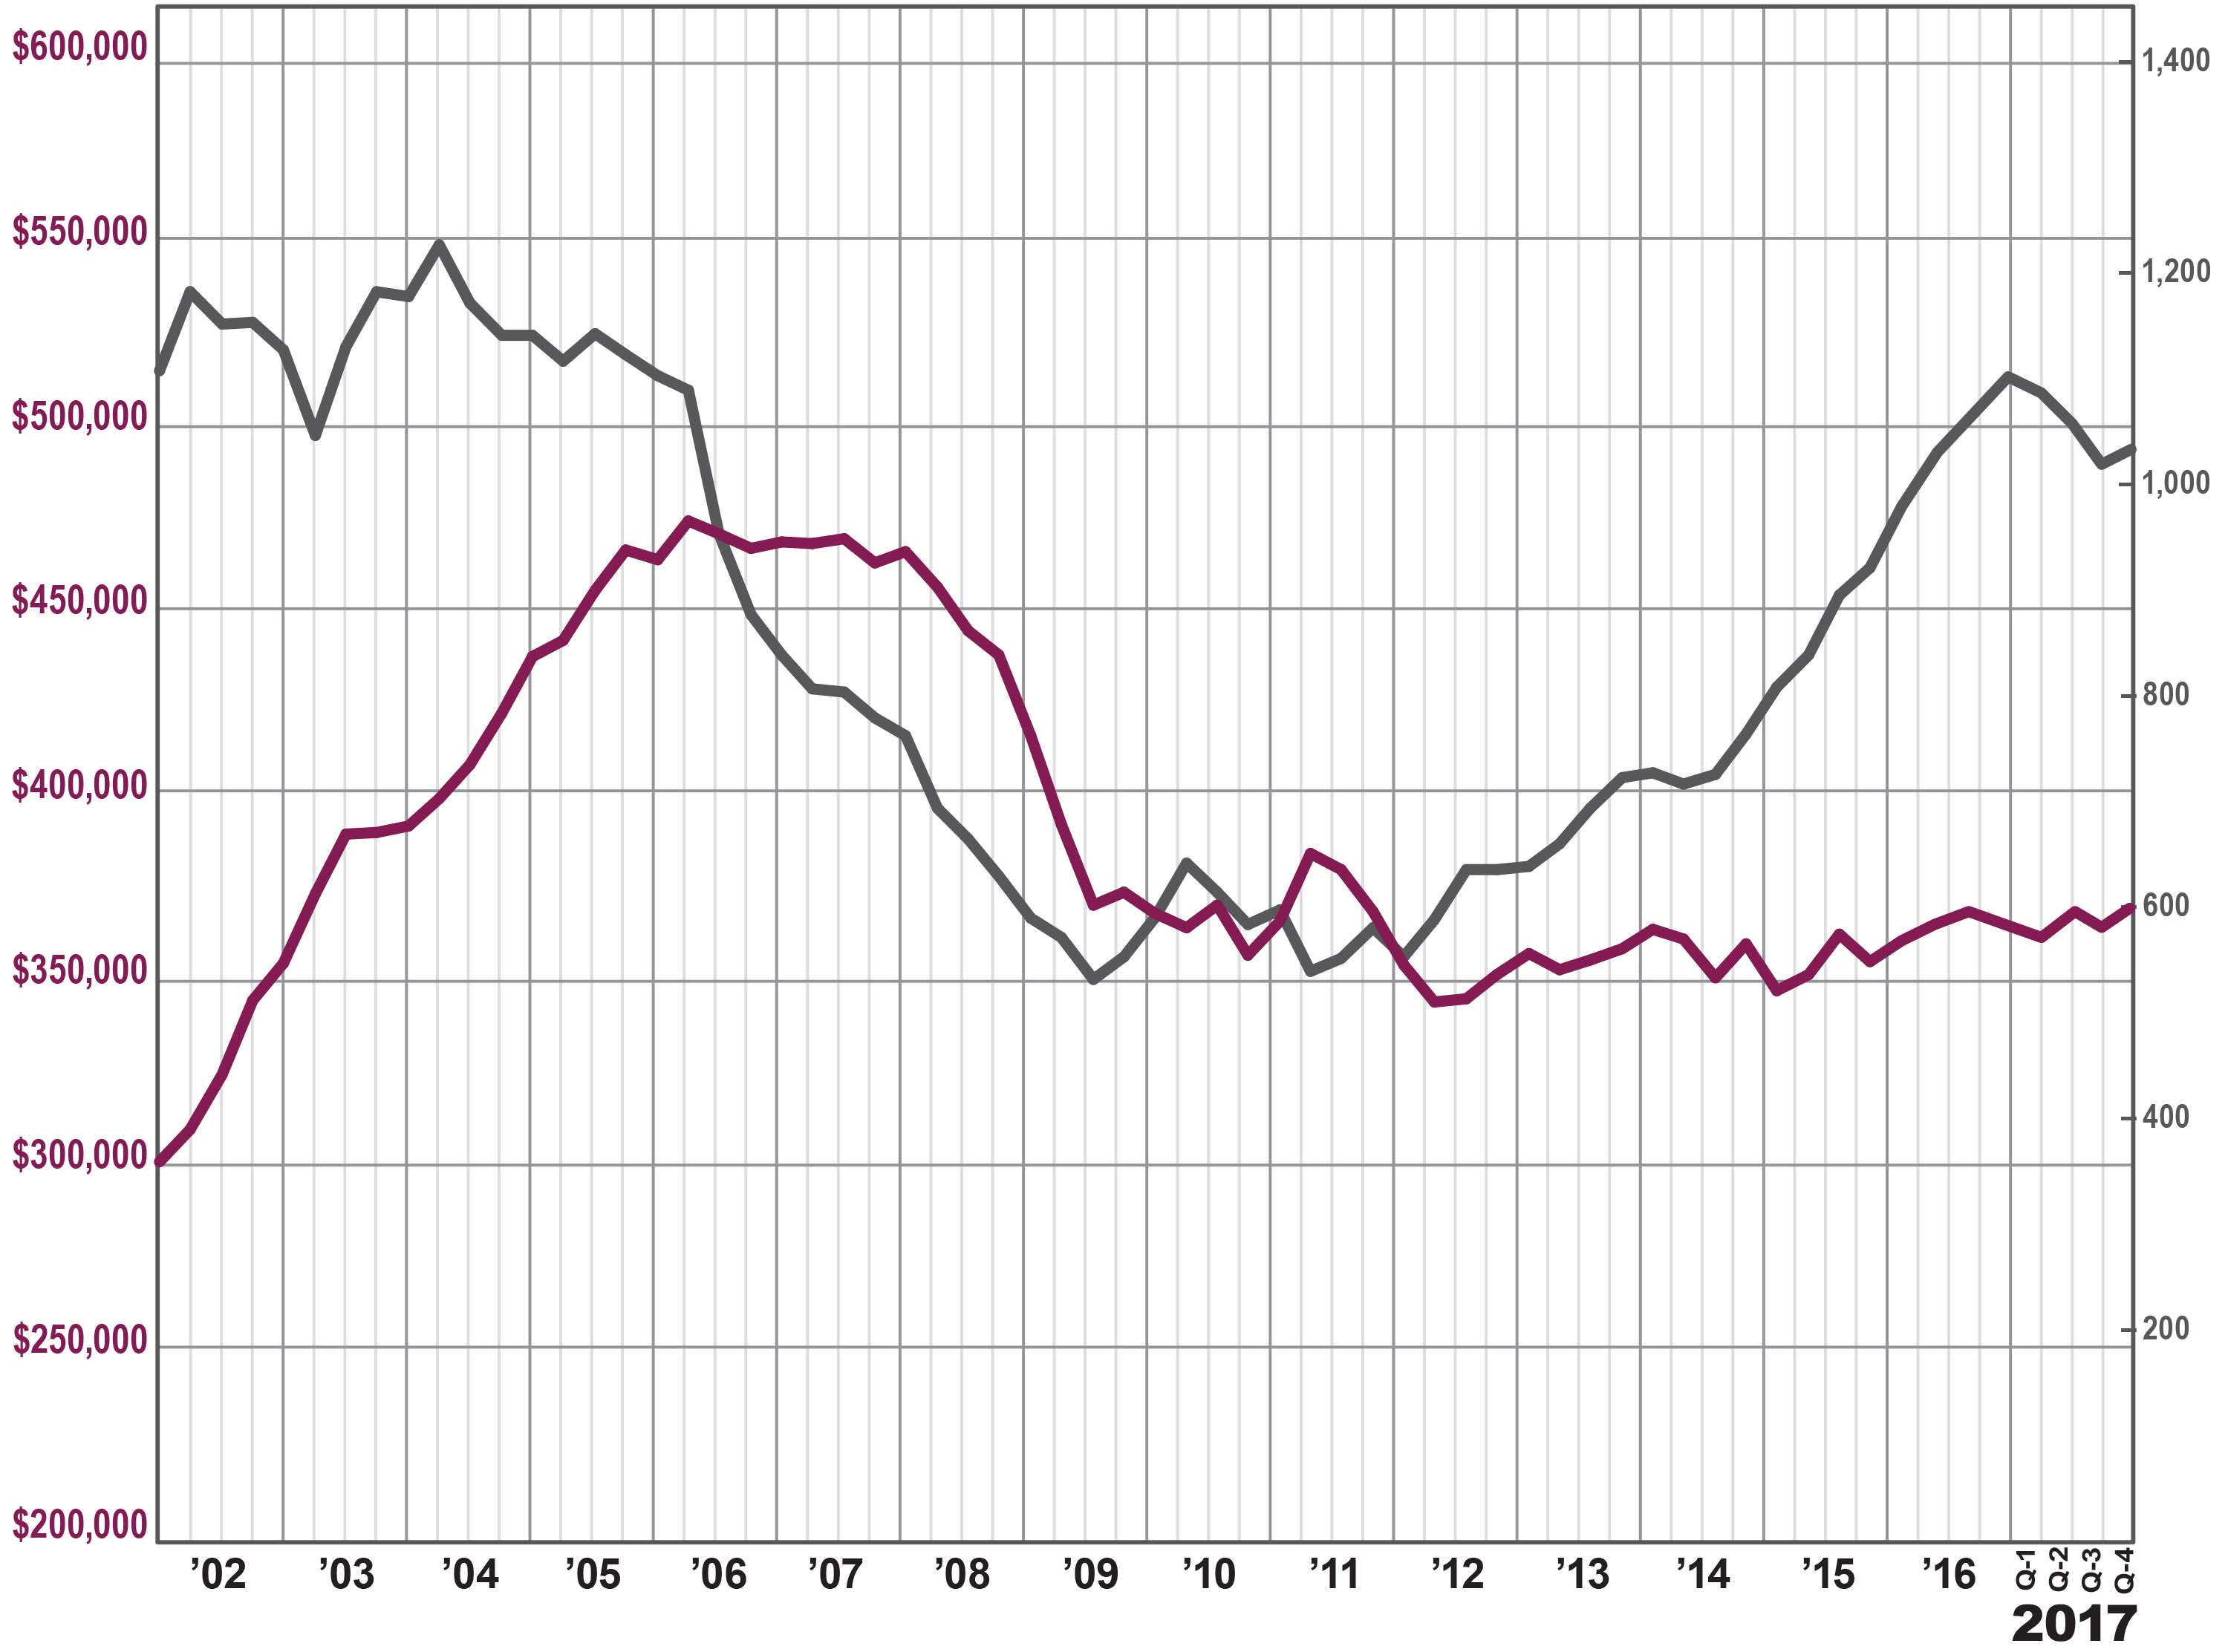
 The Putnam County housing market finished 2017 with a flourish, as low levels of inventory drove prices up dramatically.
Sales. Putnam single‑family home sales were up a tick for the quarter, following three straight quarters of decline. For the calendar year, sales were down over 7%, marking the first time in over five years where the yearly sales have gone down. This is not, though, due to a lack of demand, but rather a sign of the impact of severely low levels of inventory.
Prices. This lack of inventory drove a major spike in pricing in the fourth quarter, with prices up dramatically across the board: up almost 11% on average, over 8% at the median, and over 10% in the price‑per‑square‑foot. This was by far the largest quarterly increase in over 12 years, since the height of the last seller’s market. And one good quarter saved the year, with 2017 prices finishing up just a bit for the second year in a row.
Inventory. Inventory continued to tighten, falling over 6% and now down well below the six‑month level that usually denotes a tightening seller’s market. This lack of available homes is what’s been holding back sales, since we don’t have enough “fuel for the fire” to keep the market going.
Negotiability. The negotiability indicators support the idea that a seller’s market is emerging, with the listing retention rate up just a tick and the days‑on‑market continuing to fall.
Condos. The smallish condo market surged in the fourth quarter, with sales up over 18% and prices up just a tick. For the year, though, sales were down sharply and prices gave back a little, even while inventory continued to fall.
Going forward, we believe the Putnam County market will thrive in 2018 as a robust seller’s market. Demand will stay strong, with interest rates near historic lows, prices still at attractive 2004‑05 levels, and a strengthening economy. And if inventory remains low, prices will likely continue to appreciate meaningfully through the new year.
To learn more about Better Homes and Gardens Real Estate Rand Realty, visit their website and Facebook page, and make sure to “Like” their page. You can also follow them on Twitter.
Fourth Quarter 2017 Real Estate Market Report: Westchester County Overview
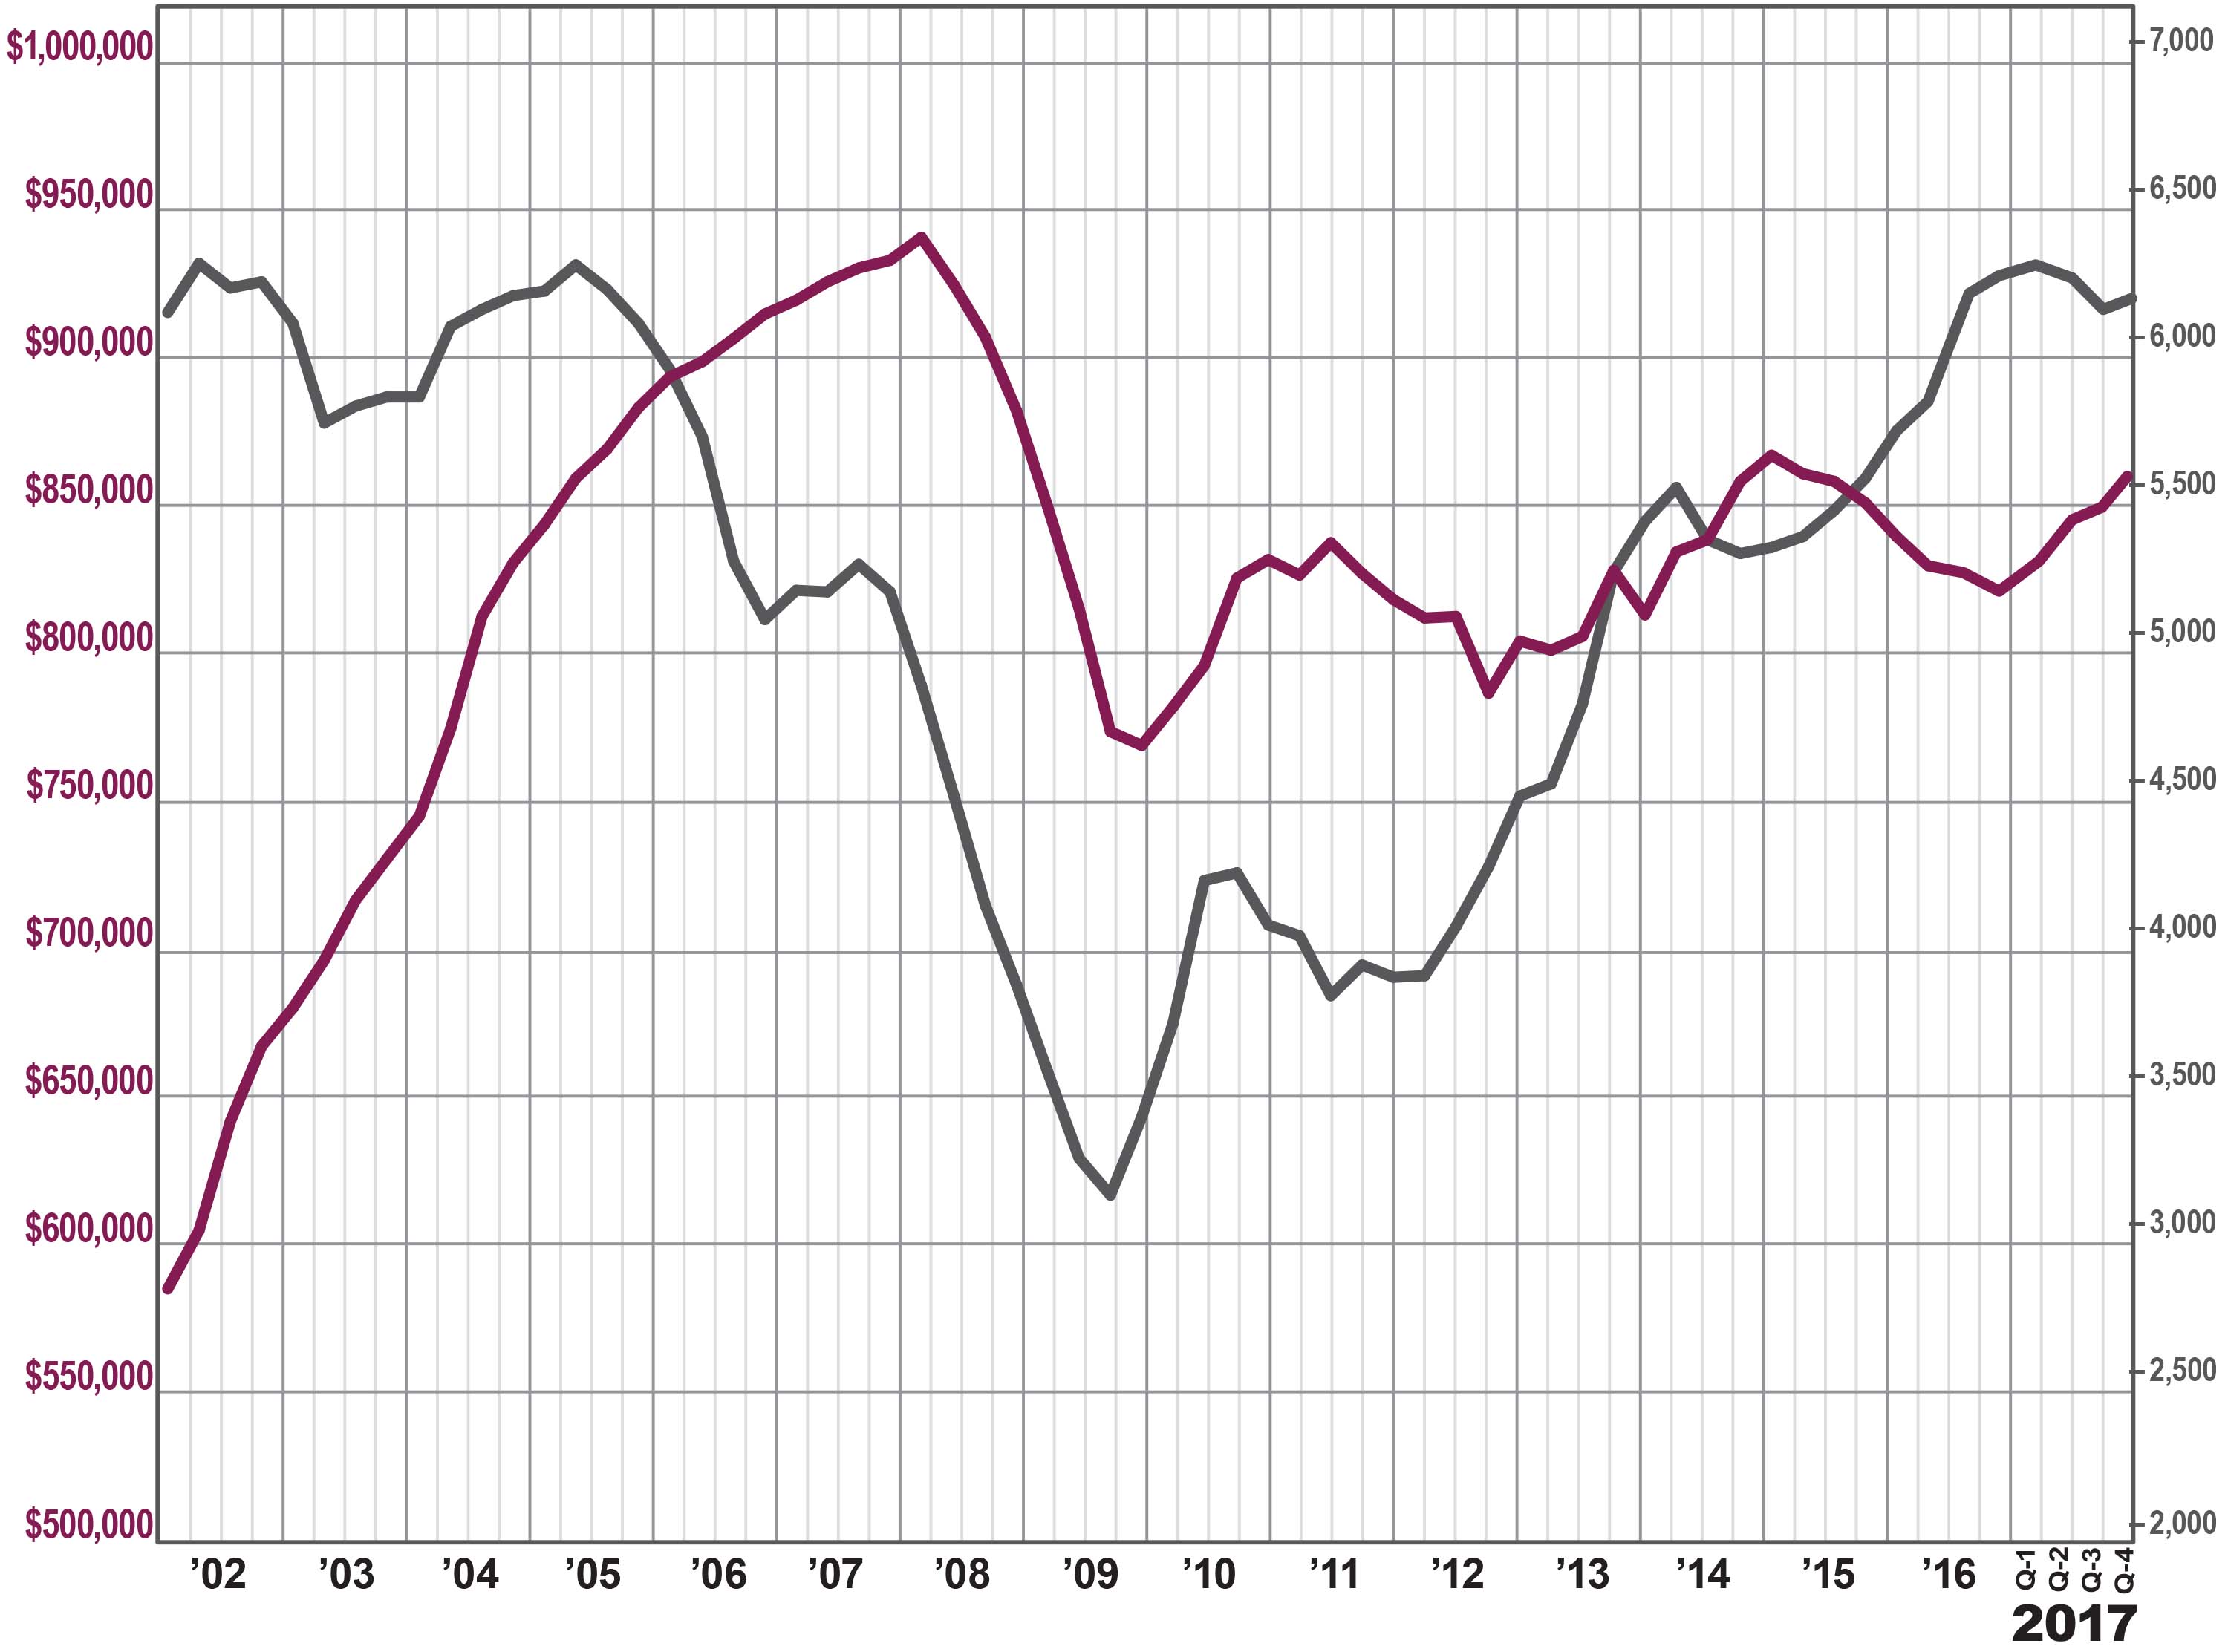
 The Westchester housing market finished strong in 2017, with a surge in prices even while a lack of inventory held back sales growth.
Sales. Home sales were up just a tick, rebounding a bit from their sudden decline in the third quarter. You can see the continued impact of a lack of inventory, though, with sales down almost 2% for the full year. Still, with over 6,100 sales for the year, transactions in Westchester are now at their highest level since 2005, and almost double where they were at the bottom of the market in 2009.
Prices. With inventory this low, and demand remaining high, we are starting to see some acceleration in price appreciation. Prices were up 5% on average and at the median for the quarter, and for the year finished up 4% on average and 3% at the median. This is welcome news for Westchester homeowners, who saw small average and median price drops over the past two years. That said, the average and median price are still at 2005 levels, without even accounting for inflation.
Negotiability. The negotiability indicators continue to signal the emergence of the seller’s market. Inventory declined again, falling over 8% and now at the lowest level of inventory we have had in Westchester in over 12 years, since the height of the last seller’s market. Similarly, for the full year, the listing retention rate was up, and the days‑on‑market was down, indicating that homes are selling more quickly and for closer to the asking price.
Condos and Coops. The condo and coop market was more uneven. The condo market was sizzling, with average prices up over 8% in the quarter and almost 5% for the year. Sales were down, but that’s certainly because inventory is below the three‑month level. The coop market was more mixed, with sales up for the year and prices relatively flat, even while inventory fell to the three‑month level.
Going forward, we expect that Westchester will continue to see meaningful price appreciation in 2018, especially if inventory remains tight. With pricing near 2005 levels and interest rates near historic lows, we believe that the seller’s market will thrive in the new year.
To learn more about Better Homes and Gardens Real Estate Rand Realty, visit their website and Facebook page, and make sure to “Like” their page. You can also follow them on Twitter.
Fourth Quarter 2017 Real Estate Market Report: Orange County Overview
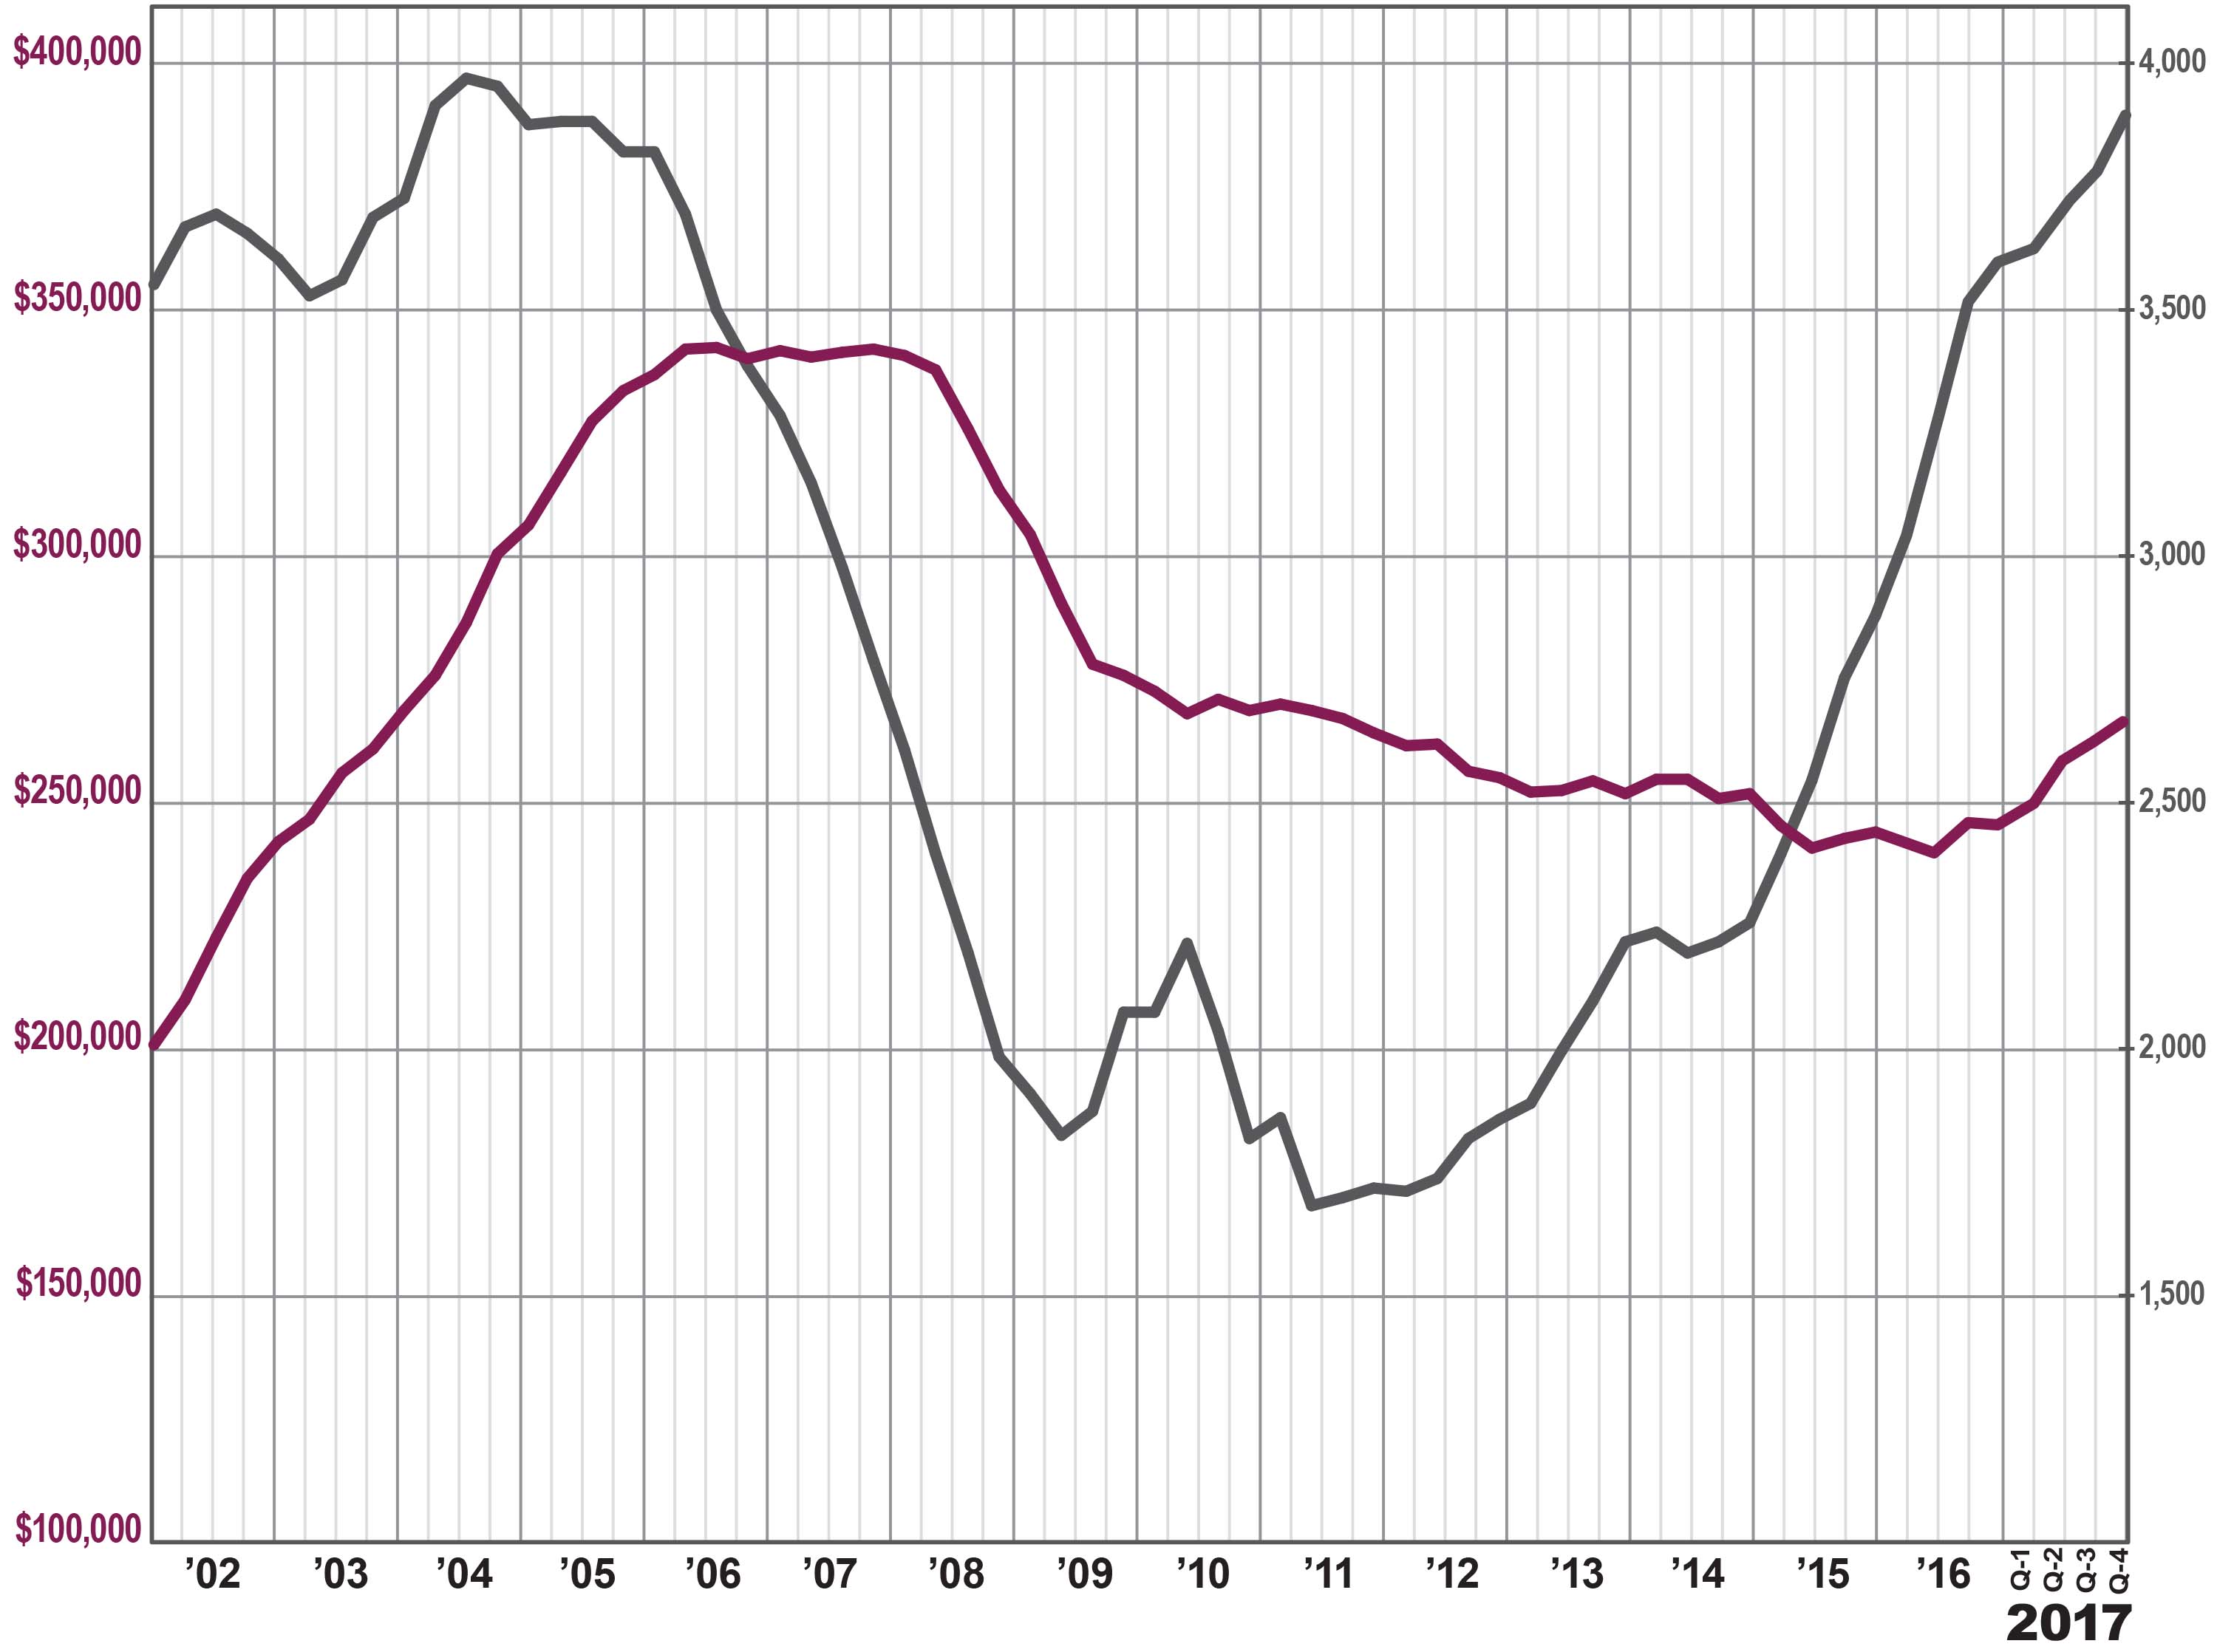
 The Orange County housing market surged again in the fourth quarter of 2017, finishing a robust year with a flourish.
Sales. Orange sales spiked in the fourth quarter, rising almost 15%. Quarterly transactions have now gone up in 13 straight quarters and 22 out of the last 23. Similarly, sales were up almost 8% for the calendar year, marking the sixth straight year of increasing transactions. Indeed, the 3,837 calendar year sales was the highest yearly total since 2004, at the height of the last seller’s market, and is more than double the sales totals from the bottom of the market in 2009.
Prices. These continued increases in buyer demand are finally having a sustained impact on pricing. Home prices rose again in the fourth quarter, up 3% on average, over 7% at the median, and almost 5% in the price‑per‑square‑foot. And for the first time in years, prices were up meaningfully for the calendar year, rising almost 5% on average, almost 6% at the median, and over 3% in the price‑per‑square‑foot. Price appreciation was a long time coming in Orange County, but it’s finally here.
Negotiability. The available inventory continues to tighten, down almost 27% and now well below the six‑month level that signals a seller’s market. Meanwhile, homes are selling more quickly and for closer to the asking price. Indeed, over the past year, the days‑on‑market average fell 23 days, and the listing retention rate rose over a full point.
Condos. The condo market absolutely exploded in the fourth quarter, continuing a welcome trend that we finally started to see this year. Sales were up a whopping 37% and prices spiked almost 13% on average and 14% at the median. For the year, sales were up almost 23% and prices were up sharply. This marked the first year where condo prices have gone up since 2007 ‑‑ over 10 years ago.
Going forward, we believe that the Orange County housing market is poised for a great year: demand is high, prices are still at attractive 2003‑04 levels, interest rates are at historic lows, and the economy is generally strong. With inventory continuing to decline, we expect to see significant sales growth and meaningful price appreciation throughout 2018.
To learn more about Better Homes and Gardens Real Estate Rand Realty, visit their website and Facebook page, and make sure to “Like” their page. You can also follow them on Twitter.
Fourth Quarter 2017 Real Estate Market Report: Rockland County Overview
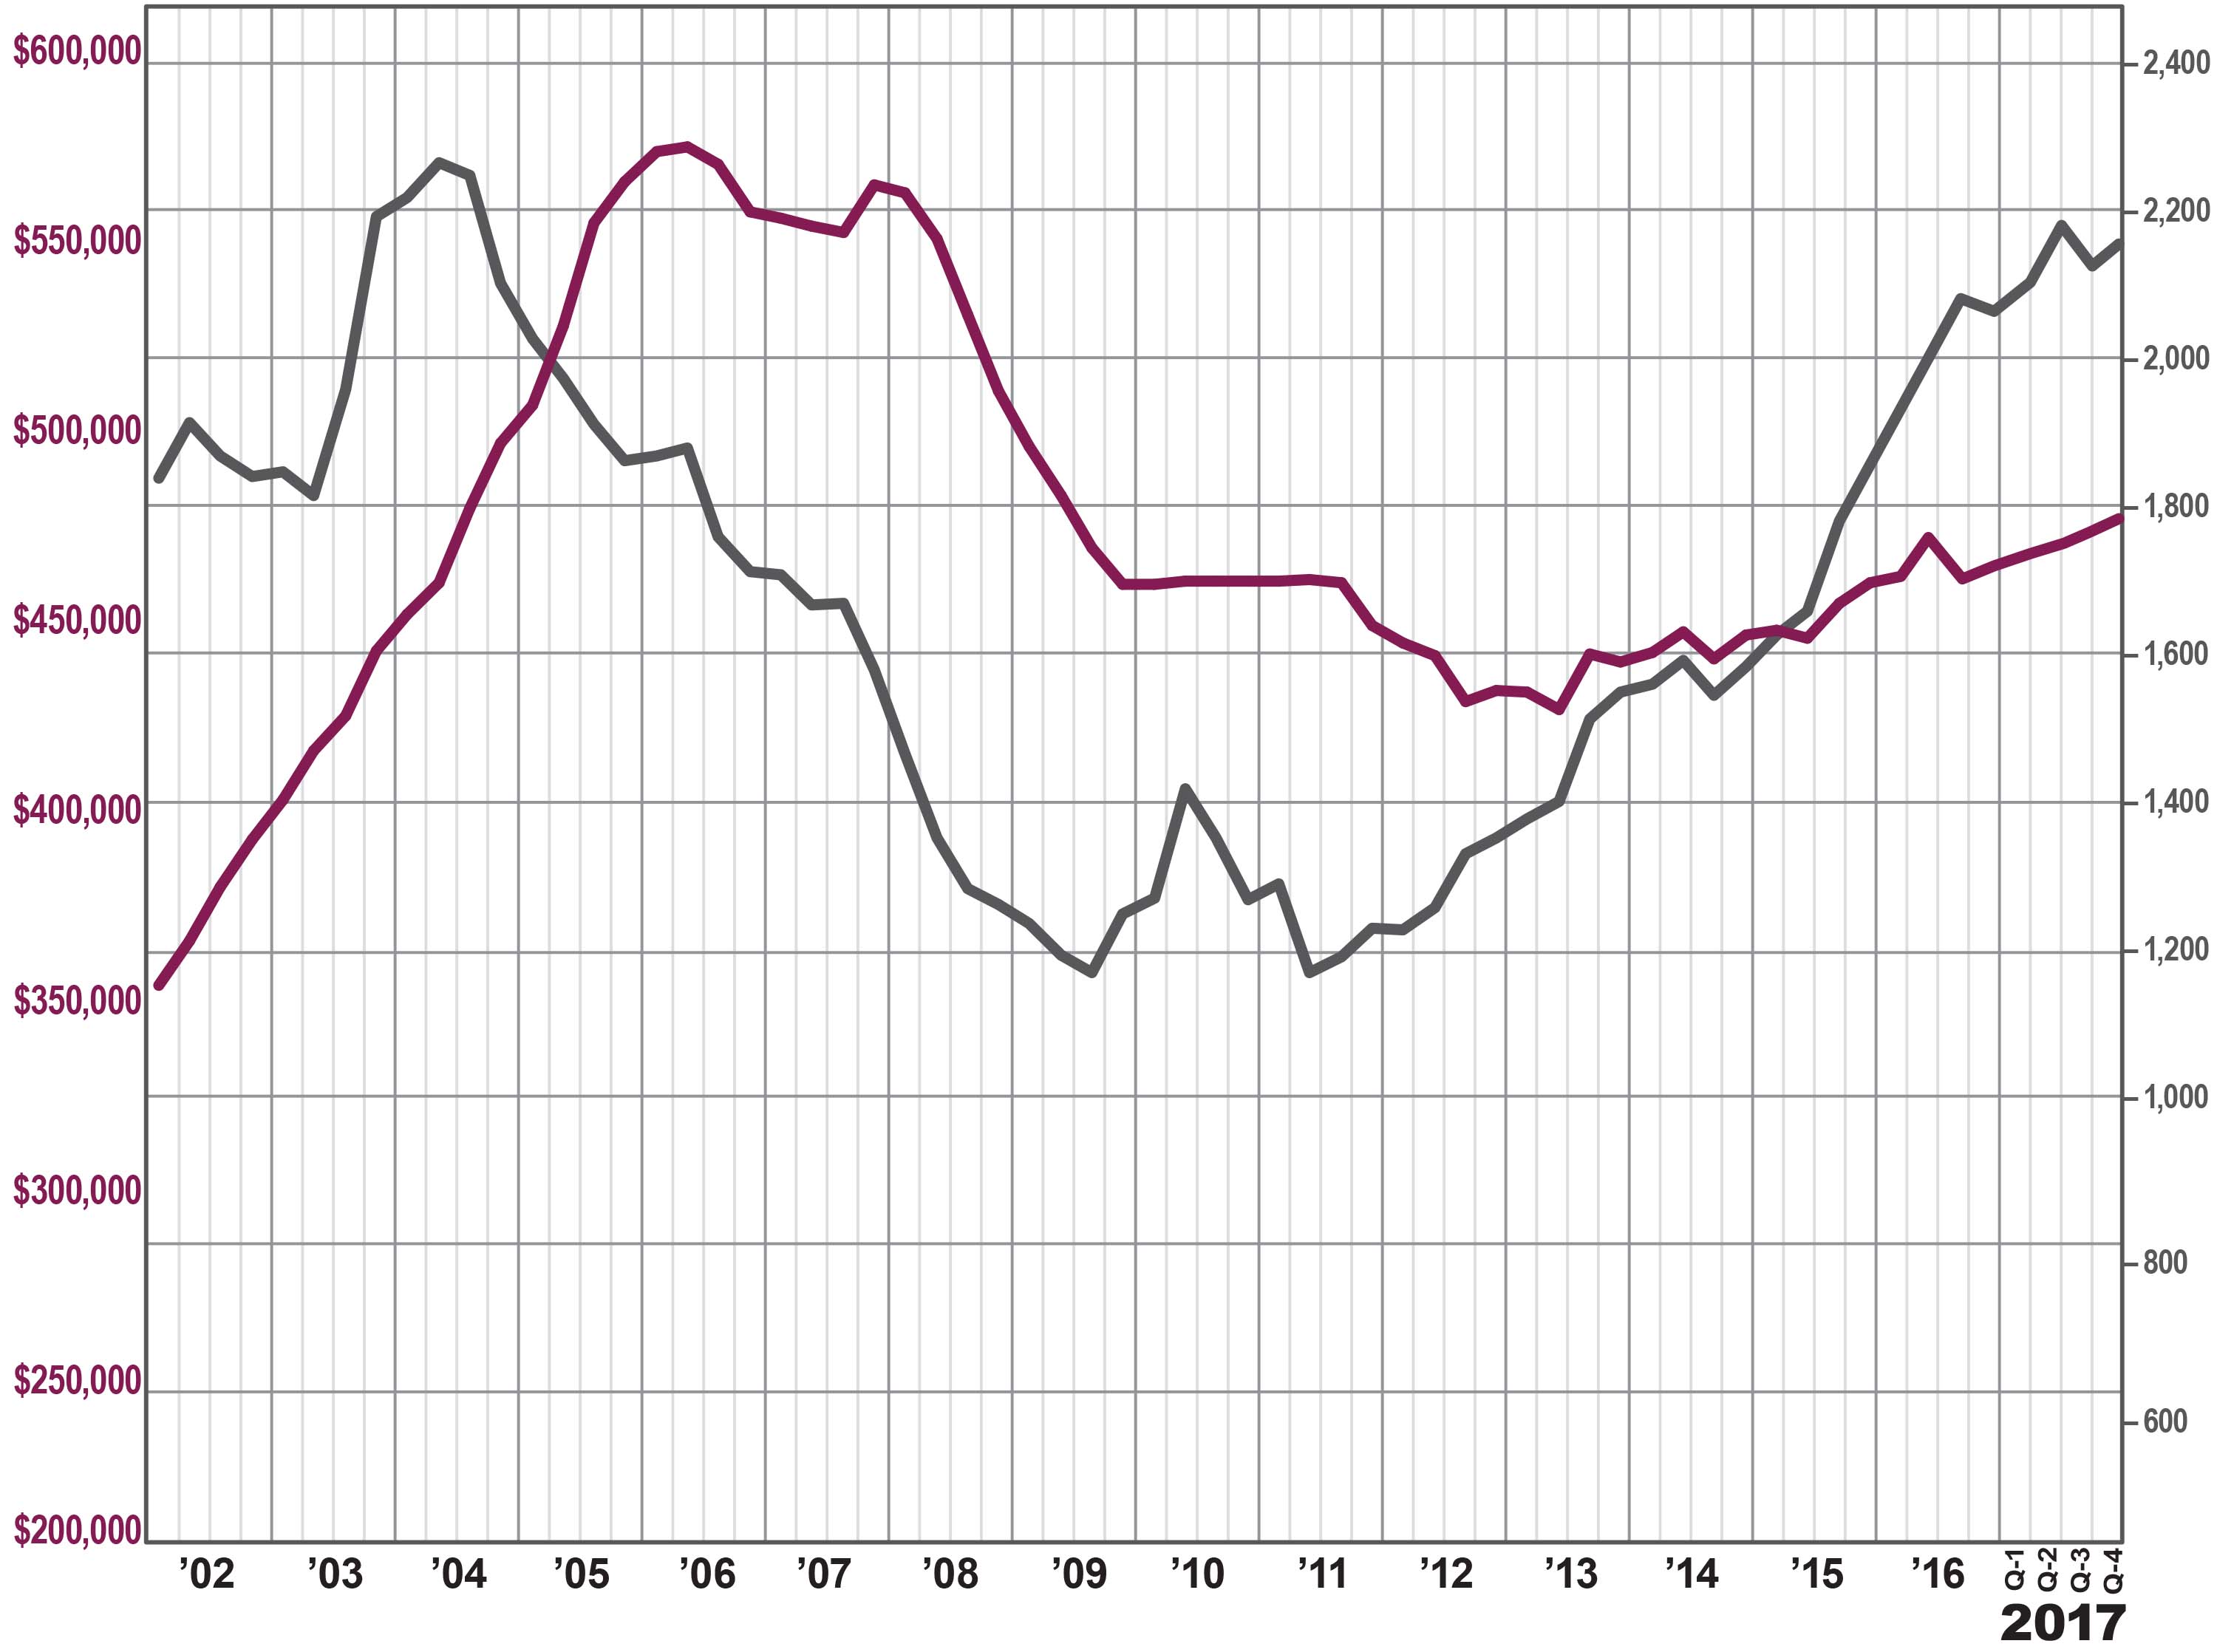
 The Rockland County housing market capped off a strong 2017 with a robust finish, with both prices and sales up significantly in the fourth quarter.
Sales. After a decline in the third quarter, sales roared back in the fourth, rising almost 11%. This drove the yearly transaction total up almost 5% for the year, marking the sixth straight calendar year of increasing sales. Indeed, the 2,140 single‑family sales in 2017 was the highest calendar year total since 2003, at the height of the last seller’s market.
Prices. These sustained increases in buyer demand have started to make a dramatic impact on prices, which were up across the board in the fourth quarter: up almost 6% on average, 4% at the median, and over 5% in the price‑per‑square‑foot. And for the calendar year, prices were up significantly, rising about 4% on average, at the median, and in the price‑per‑square‑foot. Rockland prices have now gone up for five straight calendar years, and are now up 15% from the bottom of the market in 2012. Still, though, pricing is at 2005 levels, without even accounting for inflation, so we have significant room for growth.
Negotiability. Inventory continued to fall in the fourth quarter, dropping over 18% and now down to just about four months of inventory. Similarly, the listing retention rate rose and the days‑on‑market fell sharply again, indicating that sellers are increasingly gaining negotiating leverage with buyers in this full‑blown seller’s market.
Condos. The Rockland condo market also finished strong, with both sales and prices up significantly for the year. Condo inventory is now down to almost three months, which indicates we’re looking at more price appreciation in 2018.
Going forward, we expect that buyer demand in Rockland will continue to drive prices up and inventory down. With prices still at attractive 2004 levels, interest rates near historic lows, inventory falling, and the economy generally strengthening, we believe that this sustained buyer demand will drive meaningful price appreciation through 2018.
To learn more about Better Homes and Gardens Real Estate Rand Realty, visit their website and Facebook page, and make sure to “Like” their page. You can also follow them on Twitter.
Fourth Quarter 2017 Real Estate Market Report: Westchester & Hudson Valley Market Overview
 The housing market in Westchester and the Hudson Valley finished the year strong in the fourth quarter of 2017, with meaningful price appreciation throughout the region driven by low inventory and high demand. Although sales have slumped a bit due to the lack of available homes for sale, rising prices might tempt new sellers to come into this growing seller’s market.
Inventory throughout the region continues to fall. Regional inventory was down to 4.6 months. Historically, when inventory drops below the six month level, it usually signals a seller’s market, and many of the individual counties in the region are now at‑or‑below six‑months’ worth of inventory: Westchester single‑family homes are now at 3.5, Putnam at 4.7, Rockland at 4.0, and Orange at 4.7. The lack of inventory continues to stifle sales growth. Regional sales were up for the first time in three quarters, rising almost 6% from the fourth quarter of last year. For all of 2017, sales were up less than 1%, the lowest year‑on‑year increase since 2011. But the problem isn’t lack of buyer demand, which remains strong. Rather, it’s simply that we don’t have enough homes for sale to satisfy the existing demand. Even with the lack of inventory, sales are approaching record highs. The 15,489 regional single‑family home sales in 2017 marked the highest yearly total since 2004, at the height of the last seller’s market. Indeed, sales totals are now almost doubling what we saw at the bottom of the market in 2009. Most significantly, high demand and low inventory are driving meaningful price appreciation. The regional average sales price was up for the fourth quarter in a row, rising almost 3%. We are starting to see long‑term price appreciation, with the regional average price also up 3% for the year. Moreover, appreciation was widespread, with yearlong average prices up in every county in the region: 4% in Westchester, 2% in Putnam, 4% in Rockland, 5% in Orange, and 3% in Dutchess. This is the first time we’ve seen such shared prosperity in over 10 years. Going forward, we believe that prices will continue to appreciate through 2018. Demand is strong, bolstered by near‑historically‑low interest rates, prices that are still near 2003‑04 levels (without controlling for inflation), a generally strong economy, and sharply declining inventory. The question is if we will see sales growth, which will depend on whether homeowners see prices going up and decide to get into this market, bringing fresh new listings to satiate the existing buyer demand. All in all, this is what a seller’s market looks like. High sales totals. Low inventory. Rising prices. All the signs point to an extremely robust 2018 throughout the region. WESTCHESTER
The Westchester housing market finished strong in 2017, with a surge in prices even while a lack of inventory held back sales growth.
Sales. Home sales were up just a tick, rebounding a bit from their sudden decline in the third quarter. You can see the continued impact of a lack of inventory, though, with sales down almost 2% for the full year. Still, with over 6,100 sales for the year, transactions in Westchester are now at their highest level since 2005, and almost double where they were at the bottom of the market in 2009.
Prices. With inventory this low, and demand remaining high, we are starting to see some acceleration in price appreciation. Prices were up 5% on average and at the median for the quarter, and for the year finished up 4% on average and 3% at the median. This is welcome news for Westchester homeowners, who saw small average and median price drops over the past two years. That said, the average and median price are still at 2005 levels, without even accounting for inflation.
Negotiability. The negotiability indicators continue to signal the emergence of the seller’s market. Inventory declined again, falling over 8% and now at the lowest level of inventory we have had in Westchester in over 12 years, since the height of the last seller’s market. Similarly, for the full year, the listing retention rate was up, and the days‑on‑market was down, indicating that homes are selling more quickly and for closer to the asking price.
Condos and Coops. The condo and coop market was more uneven. The condo market was sizzling, with average prices up over 8% in the quarter and almost 5% for the year. Sales were down, but that’s certainly because inventory is below the three‑month level. The coop market was more mixed, with sales up for the year and prices relatively flat, even while inventory fell to the three‑month level.
Going forward, we expect that Westchester will continue to see meaningful price appreciation in 2018, especially if inventory remains tight. With pricing near 2005 levels and interest rates near historic lows, we believe that the seller’s market will thrive in the new year.
To learn more about Better Homes and Gardens Real Estate Rand Realty, visit their website and Facebook page, and make sure to “Like” their page. You can also follow them on Twitter.
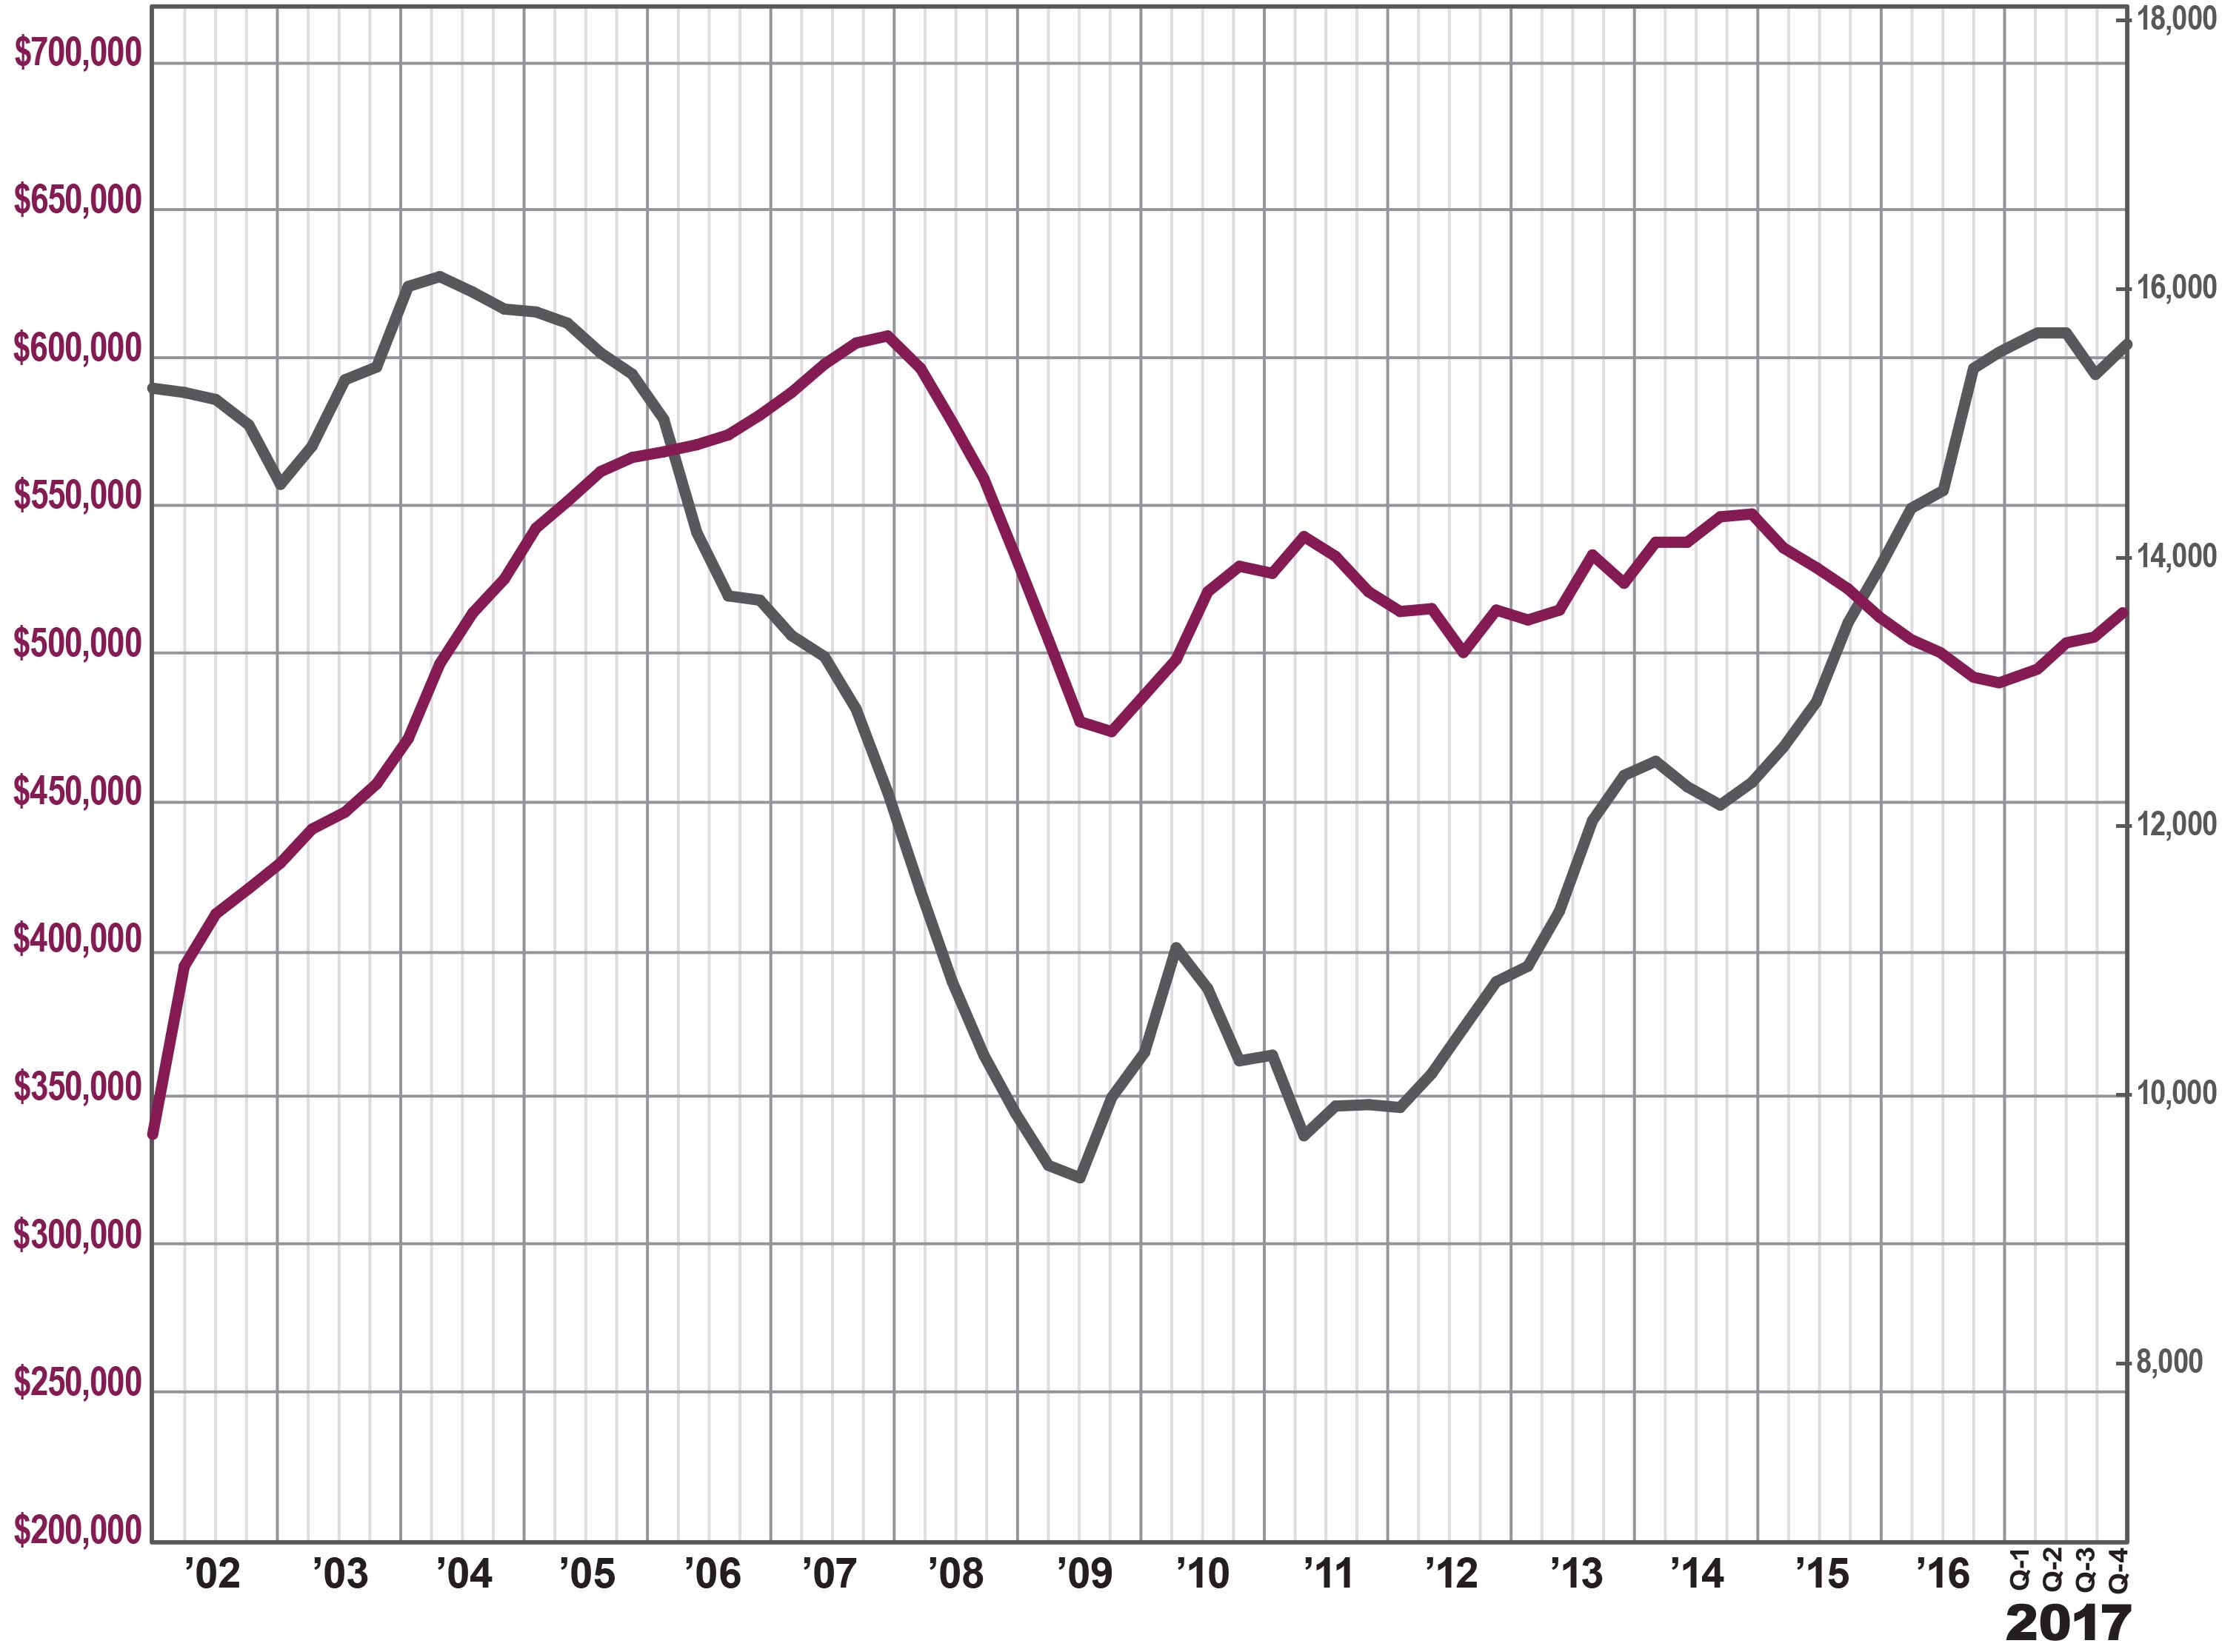
Third-Quarter 2017 Real Estate Market Report: Sussex County Market Overview
 Activity in the Sussex County housing market surged yet again in the third quarter of 2017, with sales up sharply even while prices continued to struggle.
Sales. Sussex sales were up yet again in the third quarter, rising over 17% from last year and now up over 22% for the year. The 2749 closings represented the highest 12‑month total in over 10 years. Indeed, Sussex sales have now more than doubled from the bottom of the market in 2011.
Prices. Even with these sustained increases in buyer demand, though, prices continued to struggle. We saw some “green shoots” of price appreciation at the end of 2016, with the average price up almost 8% in the fourth quarter. But prices are now down every quarter in 2017, falling 2% in the first, 2% in the second, and now 3% in the third. As a result the rolling year price is basically flat, with the media down just a tick.
Inventory. The Sussex inventory of available homes for sale fell again, dropping 11% and now down to about 10 months. That’s a significant decline, but inventory is still higher than in other Northern New Jersey counties, which are all approaching the six‑month inventory line that usually signals the beginning of a seller’s market. If inventory continues to go down, we would expect that to put some additional upward pressure on pricing.
Negotiability. The negotiability metrics indicated that sellers were gaining negotiating leverage with buyers. The days‑on‑market fell sharply, dropping by almost a month and down now to about four months of market time. And sellers were retaining a lot more of their asking price, with listing retention jumping almost two percentage points and now up to almost 97%.
Going forward, we expect that Sussex is going to continue to see rising sales that will eventually drive meaningful price appreciation. With an improving economy, homes priced at attractive levels, and near‑historically low interest rates, we expect buyer demand coupled with declining inventory to drive a strong fall market and a robust 2018.
To learn more about Better Homes and Gardens Real Estate Rand Realty, visit their website and Facebook page, and make sure to “Like” their page. You can also follow them on Twitter.
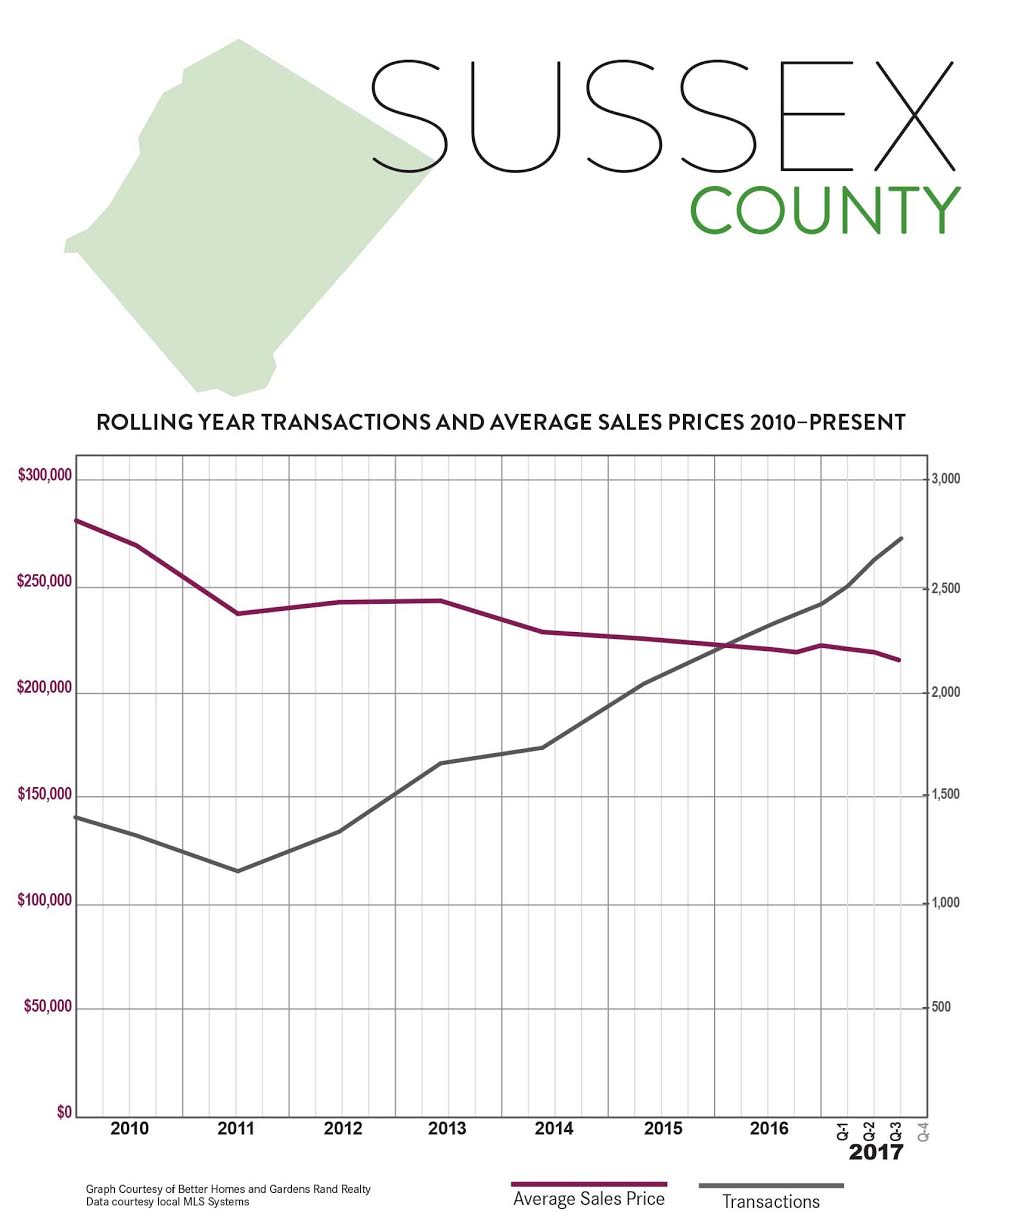
Third-Quarter Real Estate Market Report: Essex County Market Overview
 The Essex County housing market slowed a touch in the third quarter of 2017, with sales up a bit but prices mixed.
Sales. Essex sales activity was up again, rising almost 4% from the third quarter of last year. This continues a trend that’s been developing for a while, with the rolling year sales up over 9%. Indeed, Essex closed over 5,300 units over the rolling year, the largest 12‑month total since the height of the last seller’s market over 10 years ago, and up almost 70% from the bottom of the market in 2011.
Prices. Pricing, though, was mixed. Even with these sustained increases in buyer demand, the average price was down almost 2% for the quarter, even while the median was up just a tick. We see the same mixed story in the yearlong trends, with the average down just a tick while the median is up about 1%. With inventory continuing to fall and buyer demand relatively strong, we would expect prices to gain some momentum in the fall.
Inventory. Essex inventory fell again, dropping over 29% from last year’s third quarter and now down to just under six months’ worth of available homes. We measure “months of inventory” by calculating the number of months it would take to sell all the available homes at the current rate of absorption, and generally consider anything below six months to signal a seller’s market that would normally drive prices up.
Negotiability. The negotiability indicators – the amount of time sold homes were on the market, and the rate at which sellers were able to retain their full asking price – suggested the sellers might be gaining significant negotiating leverage. Most notably, the listing retention rate crossed the 100% threshold for second quarter in a row, meaning that Essex homes on average are selling for higher than the listed price. Similarly, the days‑on‑market fell about 5%, and is now down to under four months of market time. Those are both positive signals of potential future appreciation.
Going forward, we expect that Essex County’s sales activity will slowly drive some meaningful price appreciation. With homes still at historically affordable prices, interest rates low, and a generally improving economy, we believe that low inventory levels coupled with stable buyer demand will drive a strong market through the rest of 2017.
To learn more about Better Homes and Gardens Real Estate Rand Realty, visit their website and Facebook page, and make sure to “Like” their page. You can also follow them on Twitter.
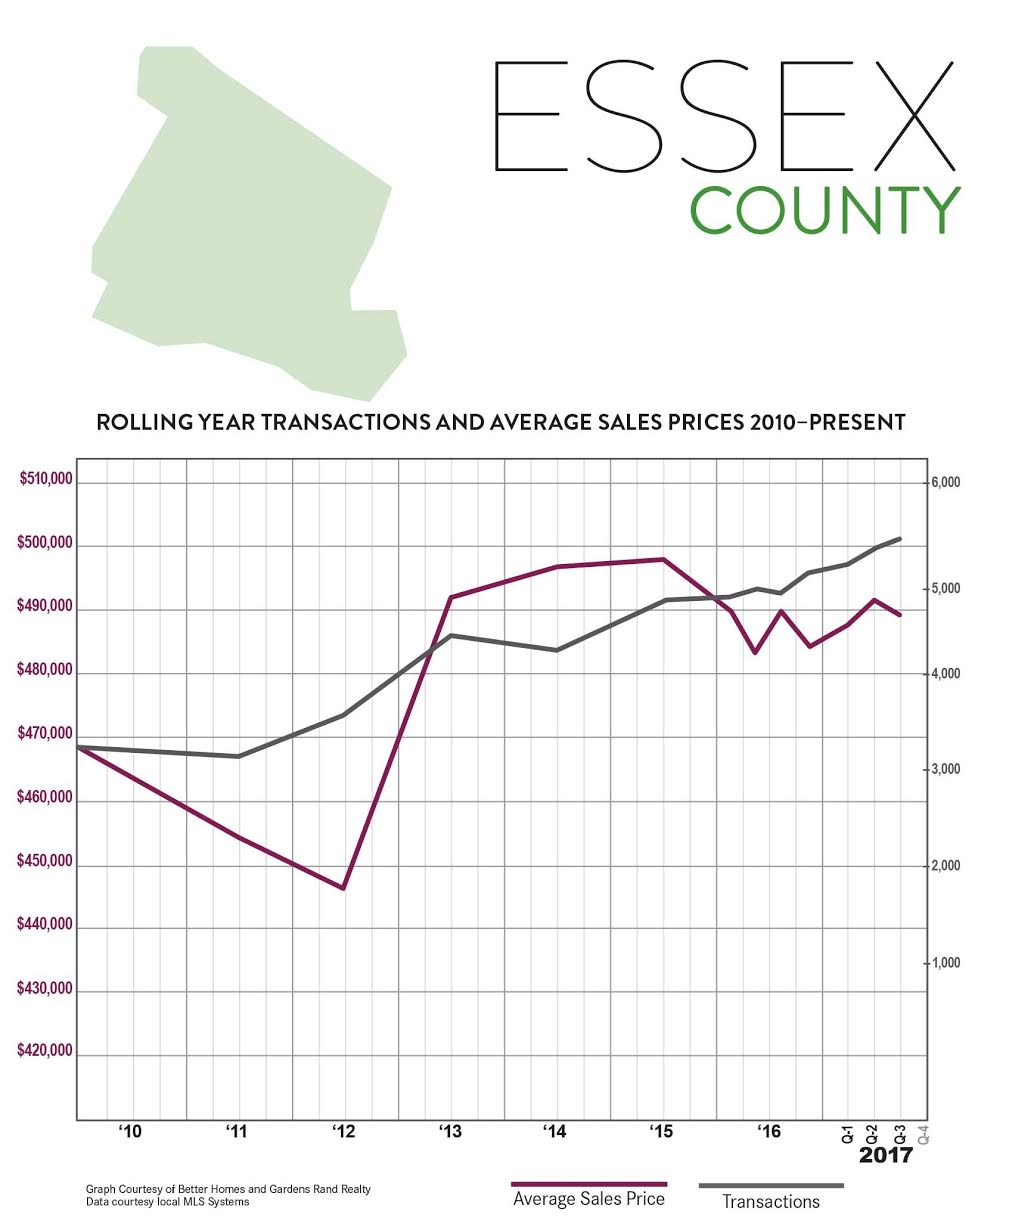
Third-Quarter 2017 Real Estate Market Report: Morris County Market Overview
 Prices in the Morris County housing market showed more signs of life in the third quarter of 2017, even while low levels of inventory continued to stifle sales growth.
Sales. Morris County sales were up just a tick, continuing a streak in which year‑on‑year sales have now gone up for 12 straight quarters, three full years of sustained buyer demand. For the year, sales were up over 5%, and are now up over 65% from the bottom of the market in 2011.
Prices. These sustained levels of buyer demand are finally having some modest impact on pricing. Continuing a trend that started this year, prices were up again, this time by about 2% on average and 3% at the median. And we are starting to see long‑term price appreciation, with the rolling year average price up 1% and the median rising over 2%. Sustained levels of buyer demand coupled with falling inventory is likely to drive pricing up through the rest of the year.
Inventory. Morris inventory fell again, dropping almost 30% from last year’s third quarter and now down to just under six months’ worth of inventory. We measure “months of inventory” by calculating the number of months it would take to sell all the available homes at the current rate of absorption, and generally consider anything below six months to signal a seller’s market that would normally drive prices up. So the fact that Morris inventory is now at that six‑month mark indicates that we could be in for some meaningful price appreciation throughout 2018.
Negotiability. The negotiability indicators showed that sellers are continuing to gain negotiating leverage with buyers. The days‑on‑market indicator was down by another 9 days, falling almost 8%, indicating that homes were selling more quickly. And the listing price retention rate continues to rise, now up to just over 98% for the quarter, signaling that sellers are having more success getting buyers to meet their asking prices.
Going forward, we expect that Morris County’s sales activity and low levels of inventory will continue to have a meaningful impact on pricing. With homes still at historically affordable prices, interest rates low, and a generally improving economy, we believe that Morris will have a strong fall market leading to a robust 2018.
To learn more about Better Homes and Gardens Real Estate Rand Realty, visit their website and Facebook page, and make sure to “Like” their page. You can also follow them on Twitter.
Third-Quarter 2017 Real Estate Market Report: Passaic County Market Overview
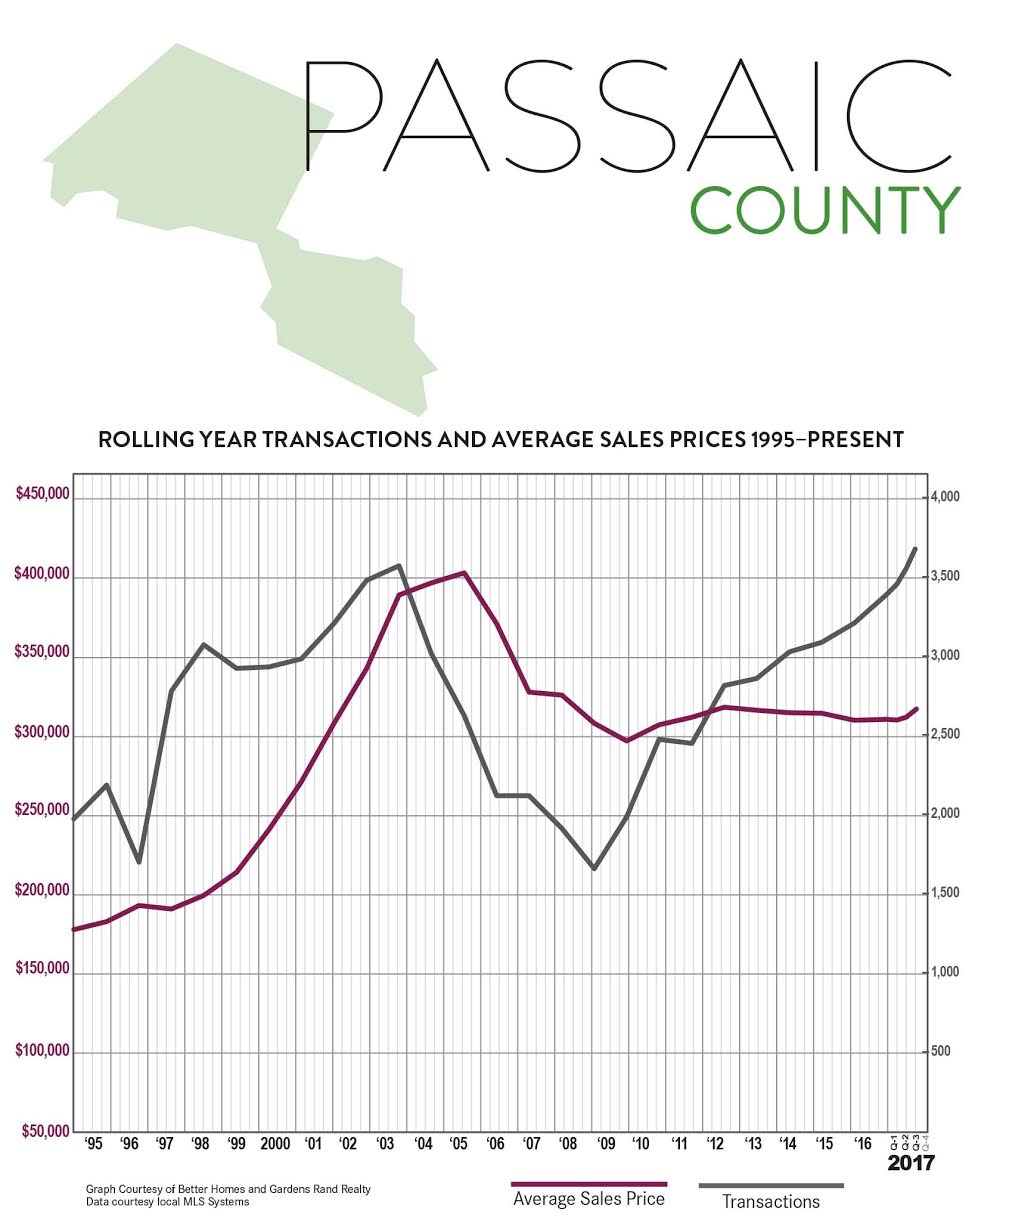
 The Passaic County housing market surged in the third quarter of 2017, with both sales and prices showing signs of a strong seller’s market.
Sales. Passaic sales were up again in the third quarter, rising over 8% and now up over 13% for the rolling year. We’ve now seen sustained increases in buyer demand for over five years, with quarterly sales up in 23 out of the last 25 quarters. As a result, Passaic closed over 3,600 homes for the calendar year, the highest total we’ve seen since the height of the last seller’s market ten years ago.
Prices. More importantly, we’re starting to see these sustained levels of buyer demand have an impact on pricing. Prices were up across the board in the third quarter, rising over 3% on average and over 6% at the median. More importantly, the yearlong trend was also positive, with prices up just a tick on average but rising almost 2% at the median. With buyer demand strong, and inventory falling, we would expect prices to continue to rise.
Negotiability. The Passaic negotiability metrics indicated that sellers are continuing to gain leverage over buyers. Inventory was down again, falling over 28% from last year, and is now down to about the six‑month level that starts to signal a rising seller’s market. Meanwhile, homes were selling more quickly and for closer to the asking price, with the days‑on‑market falling almost 15% and the listing retention rate up a full percentage point.
Going forward, we believe that Passaic’s fundamentals are sound, with homes priced at relatively attractive levels, rates near historic lows, and a stable economy. Accordingly, we expect these levels of buyer demand, coupled with declining inventory, to continue to drive price appreciation in a robust fall market and into 2018.
To learn more about Better Homes and Gardens Real Estate Rand Realty, visit their website and Facebook page, and make sure to “Like” their page. You can also follow them on Twitter.
Third-Quarter Real Estate Market Report: Bergen County Market Overview
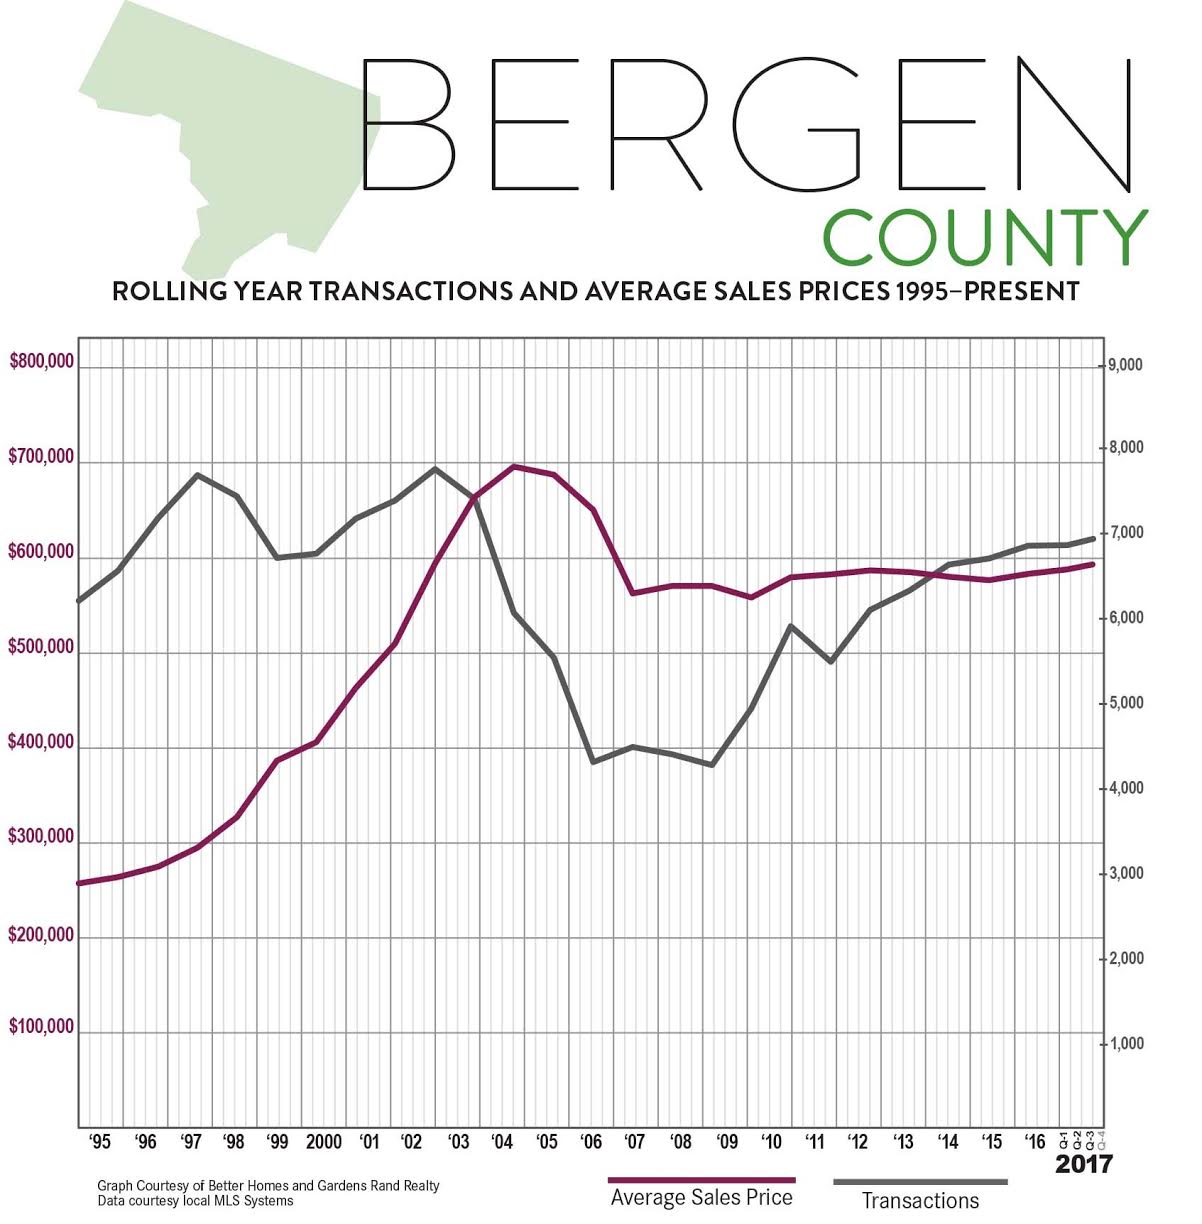
 Prices in the Bergen County housing market rose again in the third quarter of 2017, even while declining inventory stifled sales growth.
Sales. With inventory continuing to decline, Bergen lacks “fuel for the fire” to satisfy the existing buyer demand. As a result, home sales were relatively flat again, up only about 1% from last year’s third quarter and now up about 4% for the rolling year. This does, though, mark the 12th straight quarter of year‑on‑year sales growth, over three full years of rising sales. What’s holding sales back right now is not a lack of demand, but a lack of inventory. If we start seeing more homes hit the market, we’ll see sales go up sharply.
Prices. These sustained increases in buyer demand are having their expected impact on pricing. Bergen prices rose again in the third quarter, up 3% on average and almost 6% at the median. And for the year, prices are now up significantly: rising almost 5% on average and over 4% at the median.
Negotiability. All the negotiability indicators are also signaling a rising seller’s market. Inventory continued to tighten in the third quarter, with the months of inventory falling almost 17% and now down to well under five months. Similarly, homes are continuing to sell more quickly and for closer to the asking price: the listing retention rate is now over 97%, and the days‑on‑market is down to under two months. As inventory tightens and the market heats up, we would expect to see sellers continue to gain negotiating leverage.
Condos. Activity in the Bergen condo market was up in the third quarter, with sales rising almost 5% from last year. Prices were down, though, with the average falling over 3% and the median down almost 6%. With inventory now down well below six months, though, we would expect to eventually see more meaningful price appreciation.
Going forward, we expect Bergen County will enjoy a strong fall market with both rising sales and prices. With inventory tightening, a relatively strong economy, near‑historically‑low interest rates, and prices still at attractive 2004‑05 levels, we believe that sustained buyer demand will continue to drive meaningful price appreciation through the rest of 2017 and into next year.
To learn more about Better Homes and Gardens Real Estate Rand Realty, visit their website and Facebook page, and make sure to “Like” their page. You can also follow them on Twitter.


