
 Facebook
 X
X
 Pinterest
 Copy Link
Third Quarter 2019: Real Estate Market Report – Morris County, New Jersey
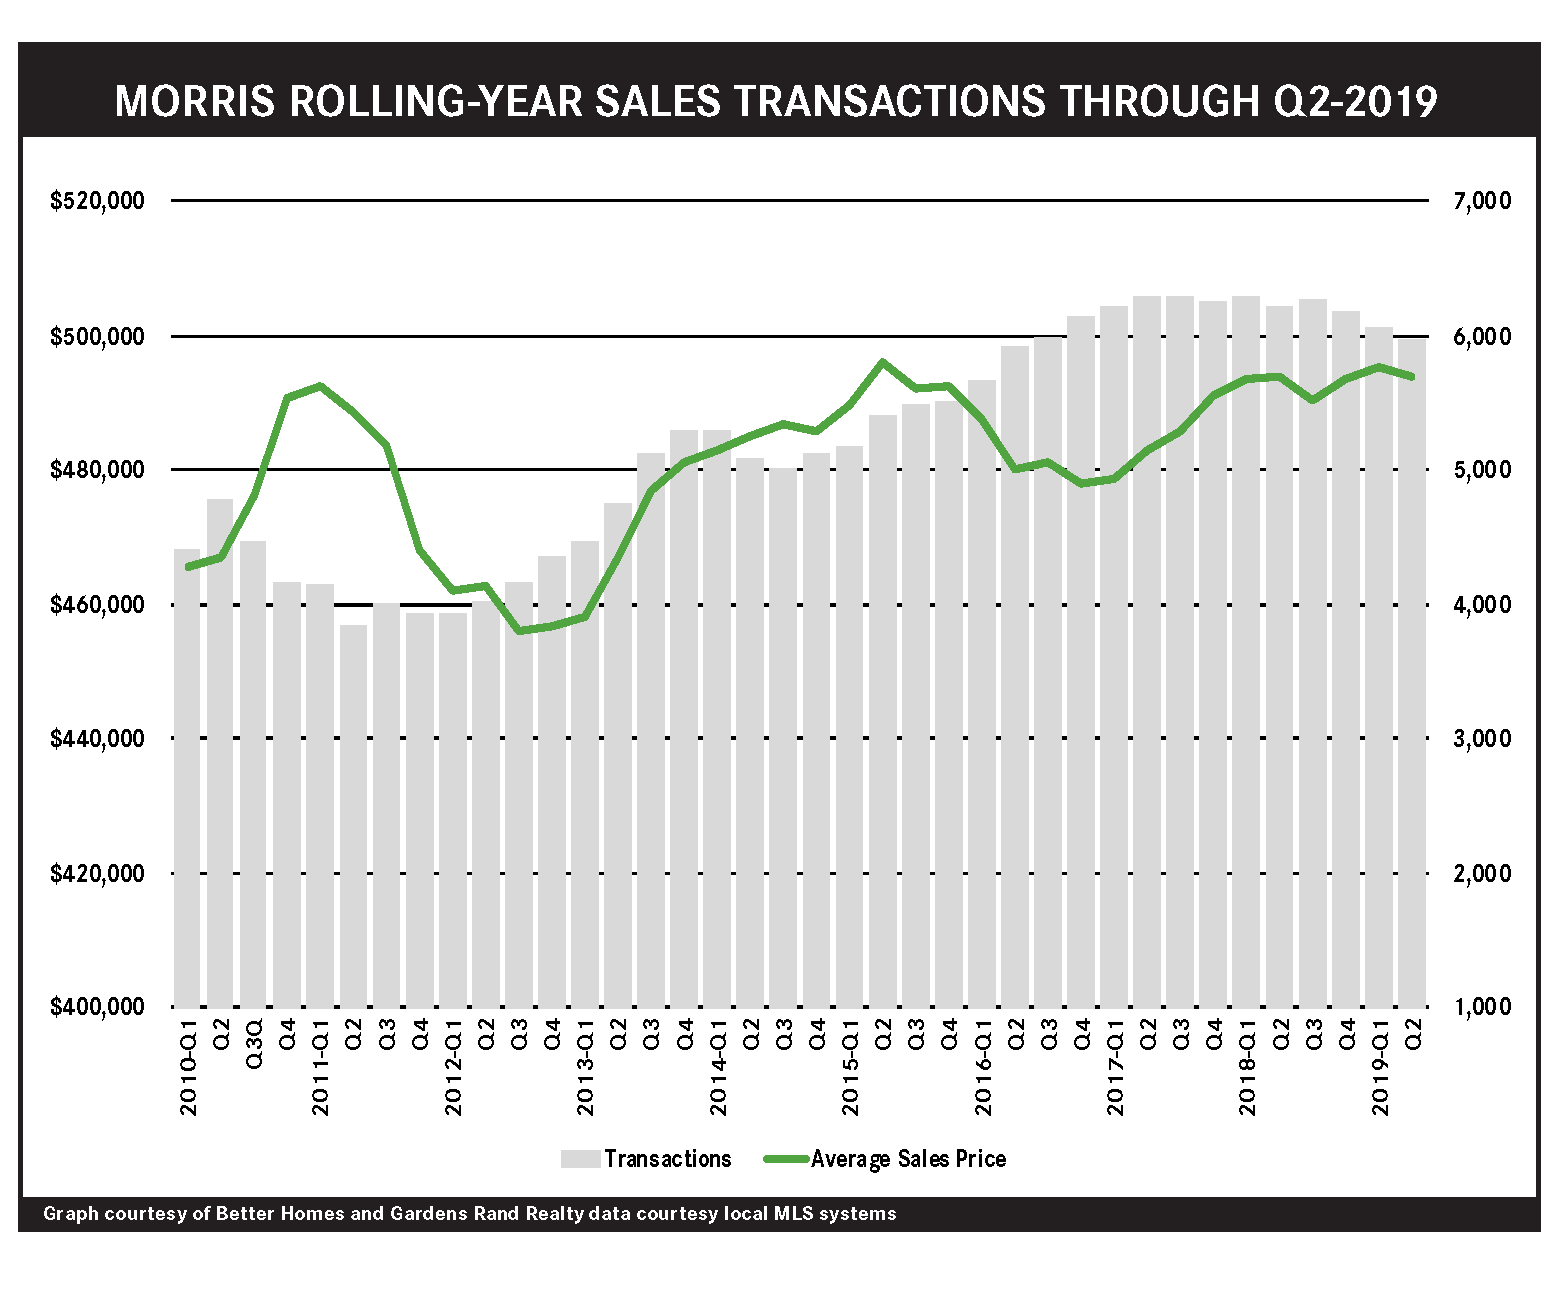
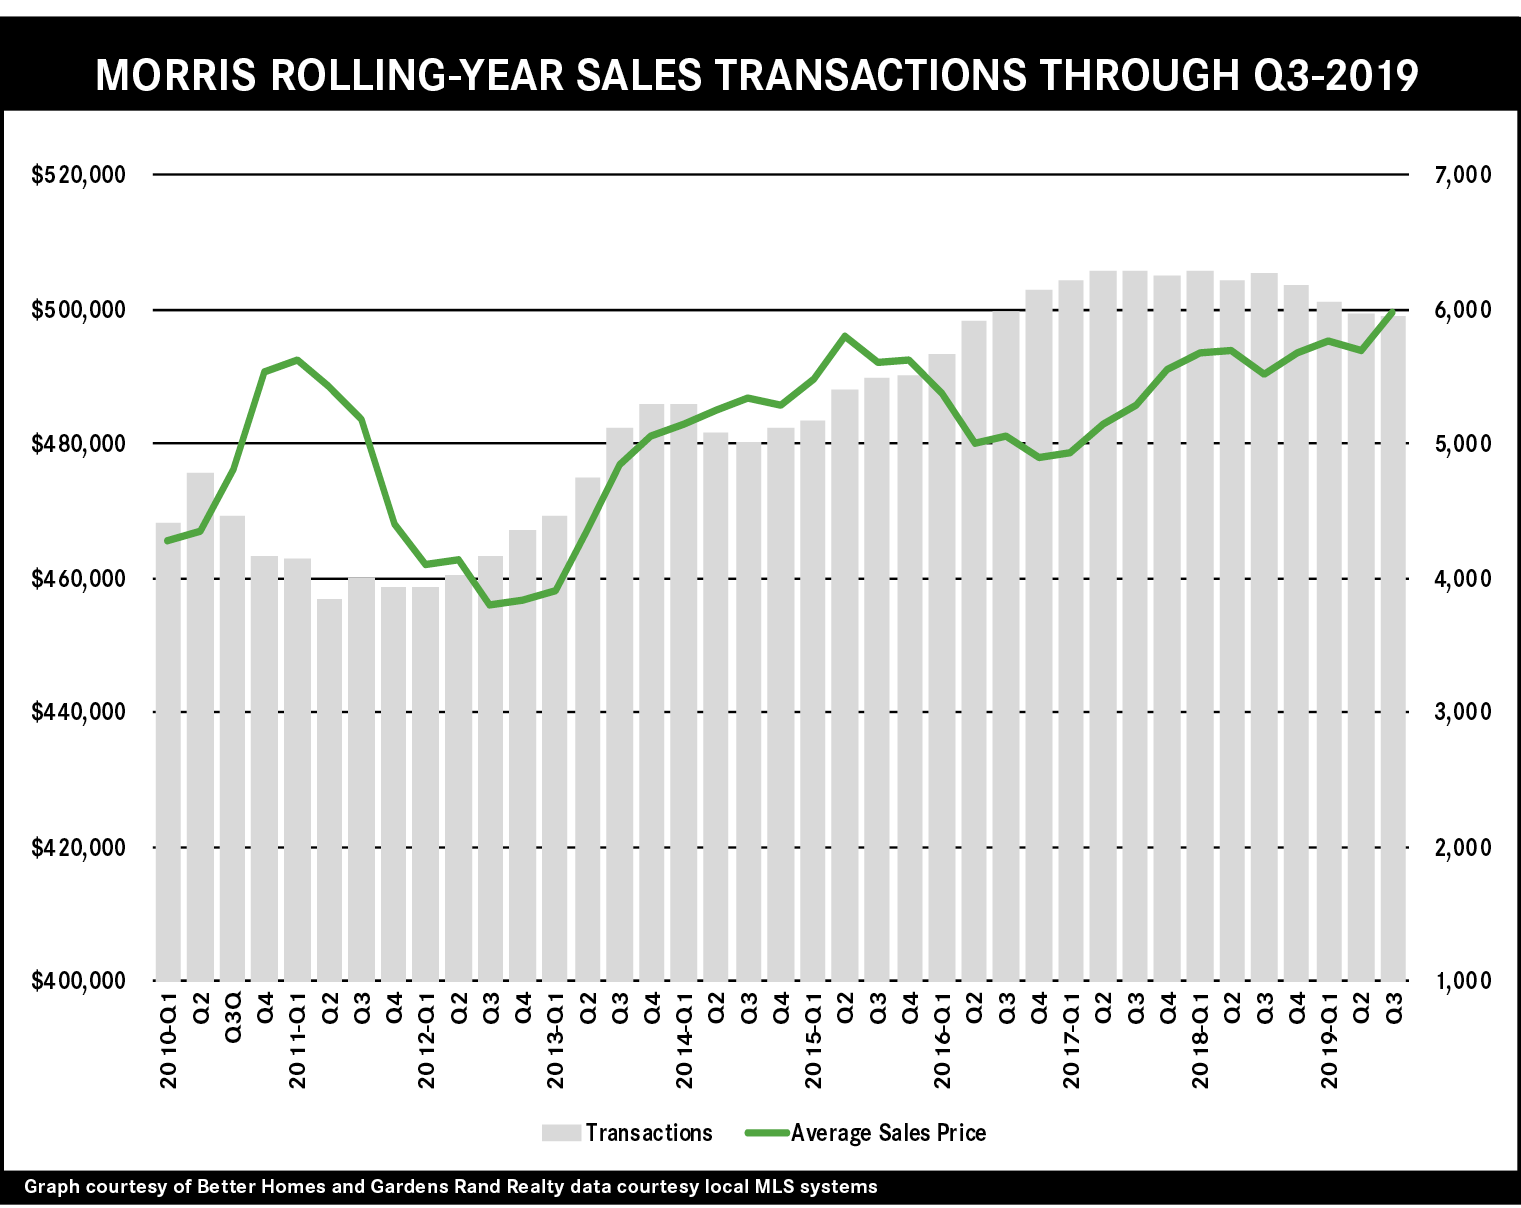
The Morris County housing market surged forward in the third quarter of 2019, with prices rising sharply even while limited inventory stifled sales growth. Prices experienced their biggest quarterly jump in over two years, rising almost 4% on average and 5% at the median compared to the third quarter of last year. For the rolling year, prices were up more modestly, reflecting how pricing has been a little more lackluster through most of 2019. Meanwhile, though, sales are down, falling 1% for the quarter and now down 5% for the rolling year, mostly because relatively low levels of inventory are stifling sales activity. But inventory went up almost 20% in the quarter, the largest increase in about 10 years, because sellers are starting to see prices go up and are getting tempted into the market. Going forward, we believe that if inventory continues to rise to meet buyer demand, the market is poised for both sales and price growth through the winter and into 2020. The market fundamentals are strong: the economy is solid, interest rates are back down to historic lows, and home values are still below their heights from the last seller’s market.
Third Quarter 2019: Real Estate Market Report – Essex County, New Jersey
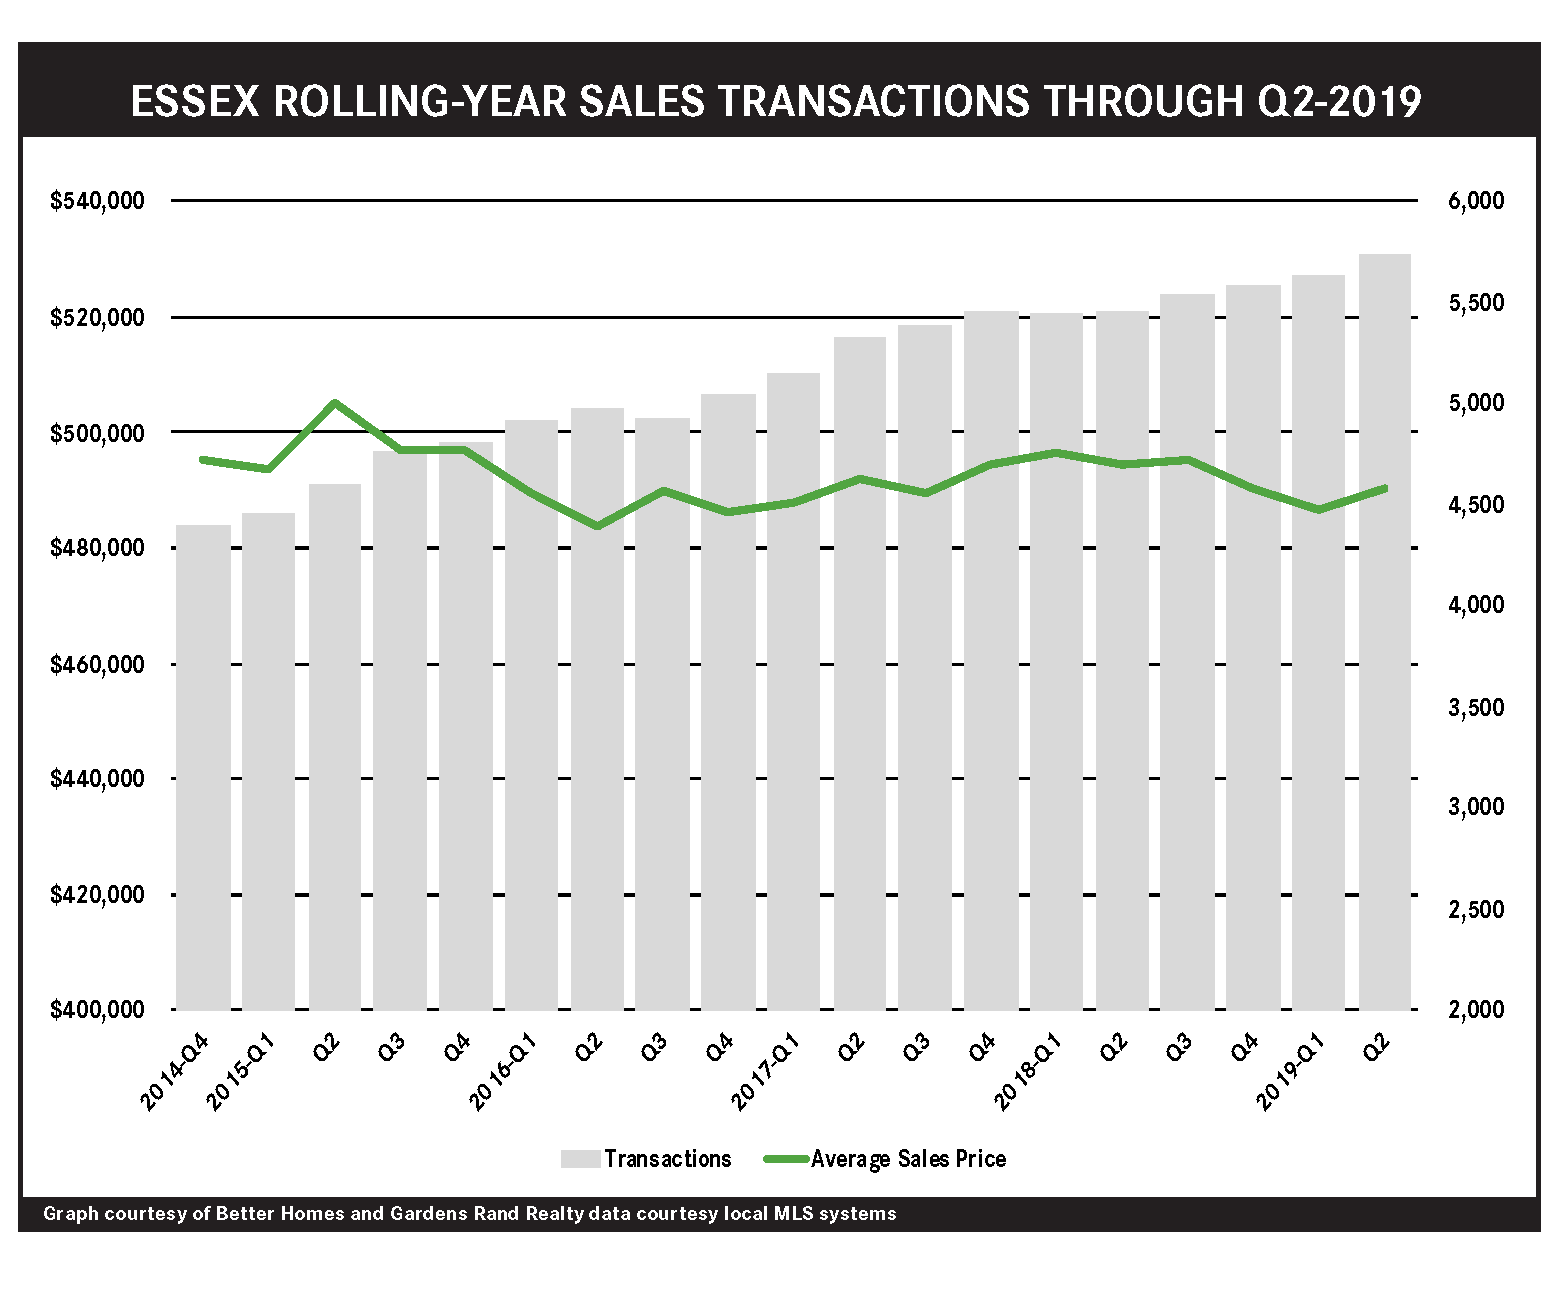
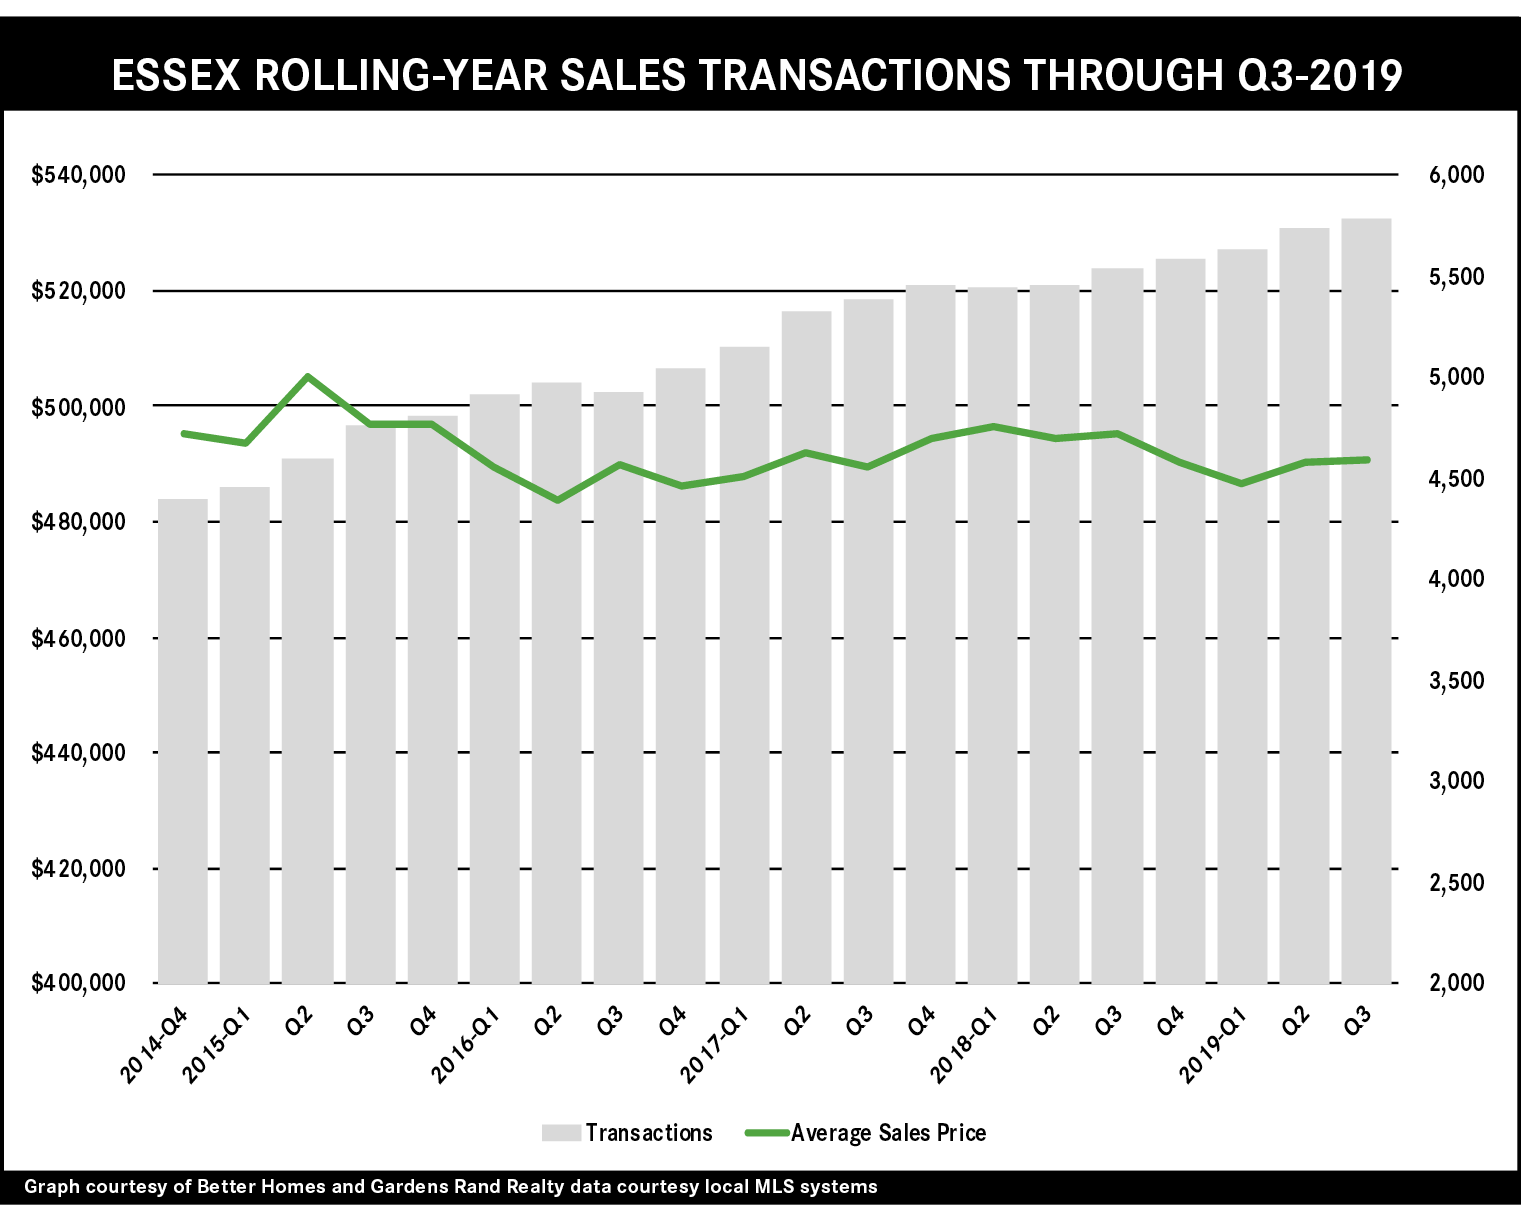
Sales in the Essex housing market went up yet again in the third quarter of 2019, even while prices leveled off after some modest increases earlier in the year. Sales rose almost 3% for the quarter, and finished the rolling year up almost 5%. But this continued increase in sales is not yet having a sustained impact on pricing, which was flat on average and down almost 3% at the median compared to the third quarter of last year. And if you look at the rolling year, pricing is virtually flat, down just a tick on average and at the median. We might be seeing some impact from the 2018 Tax Reform’s $10,000 cap on state and local tax deductions (SALT Cap), which particularly affected higher‑income taxpayers like Essex County homeowners and home buyers, who are more likely to itemize their deductions and feel the pinch. Going forward, though, we expect that the SALT Cap’s impact will eventually get priced into the market, and believe that the seller market fundamentals are strong: a growing economy, prices well below historic highs, low interest rates, and low levels of inventory. Accordingly, we expect modest sales growth and appreciation through the winter and into the 2020 market.
Third Quarter 2019: Real Estate Market Report – Sussex County, New Jersey
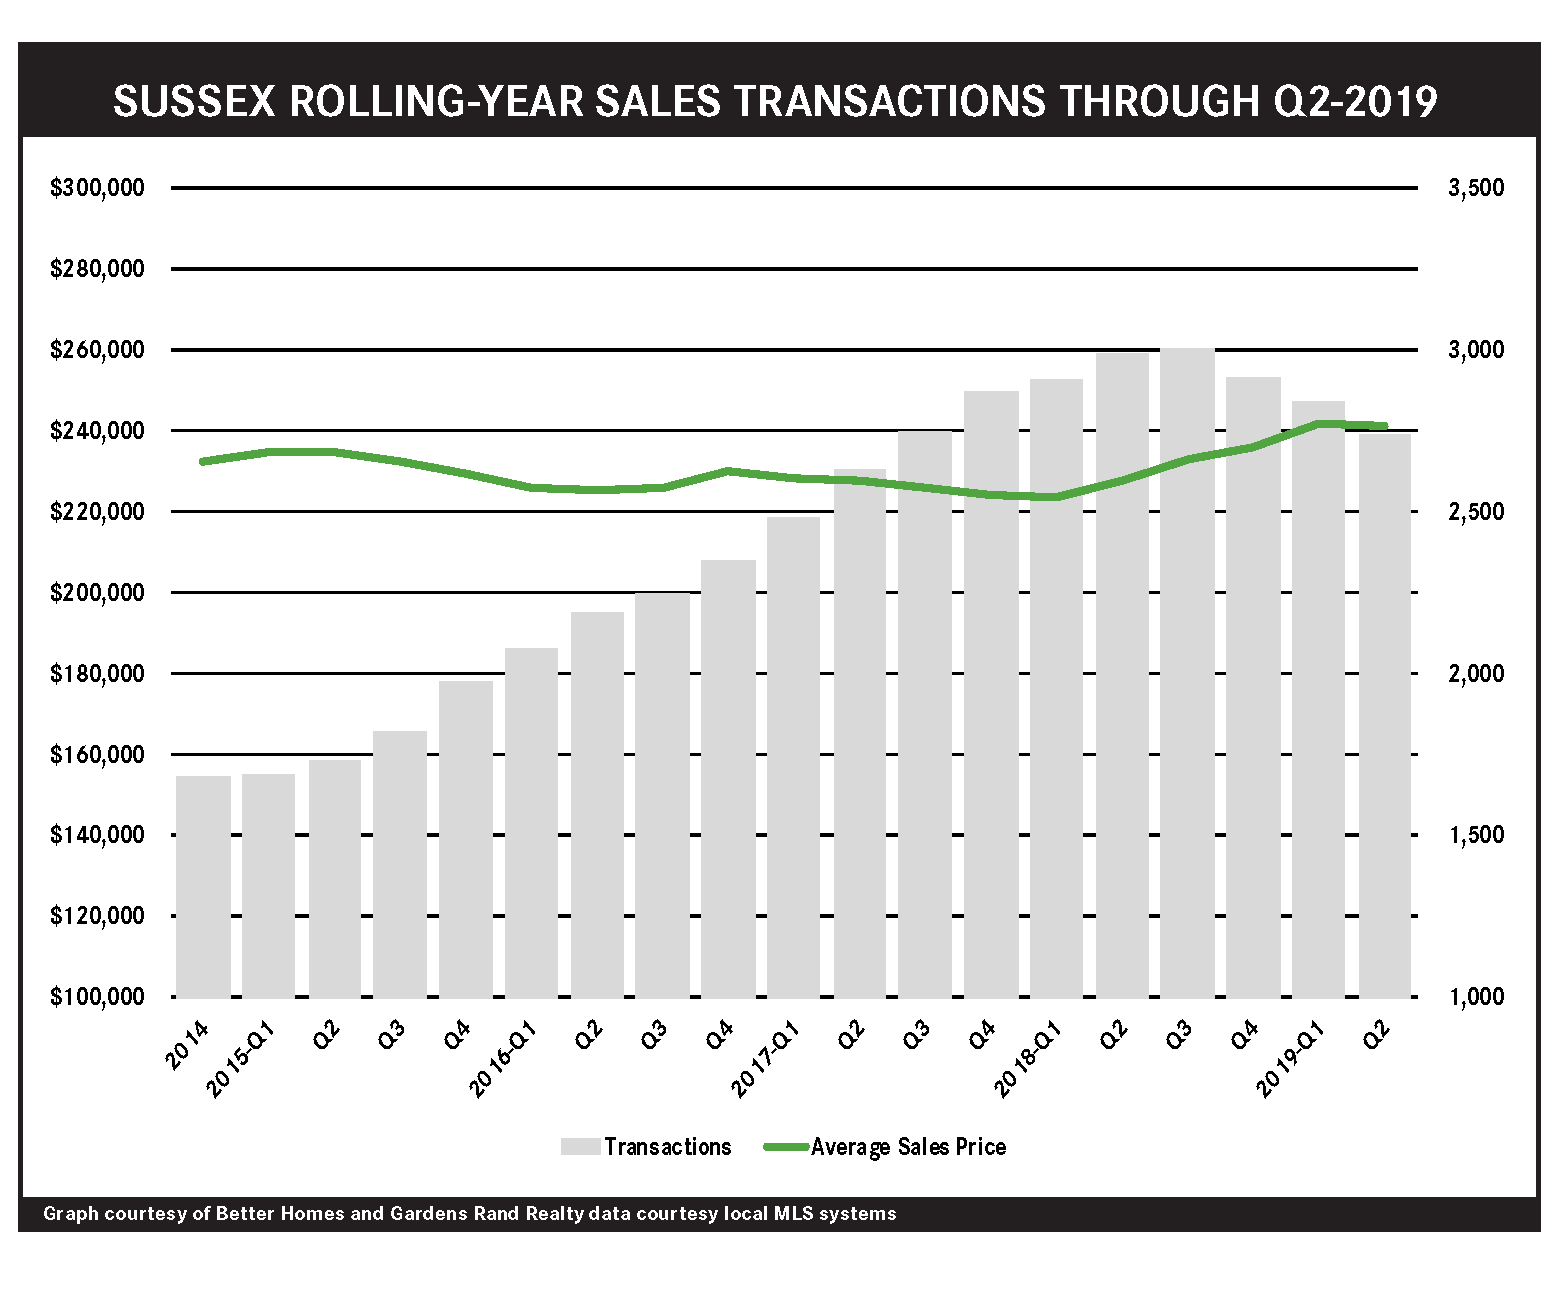
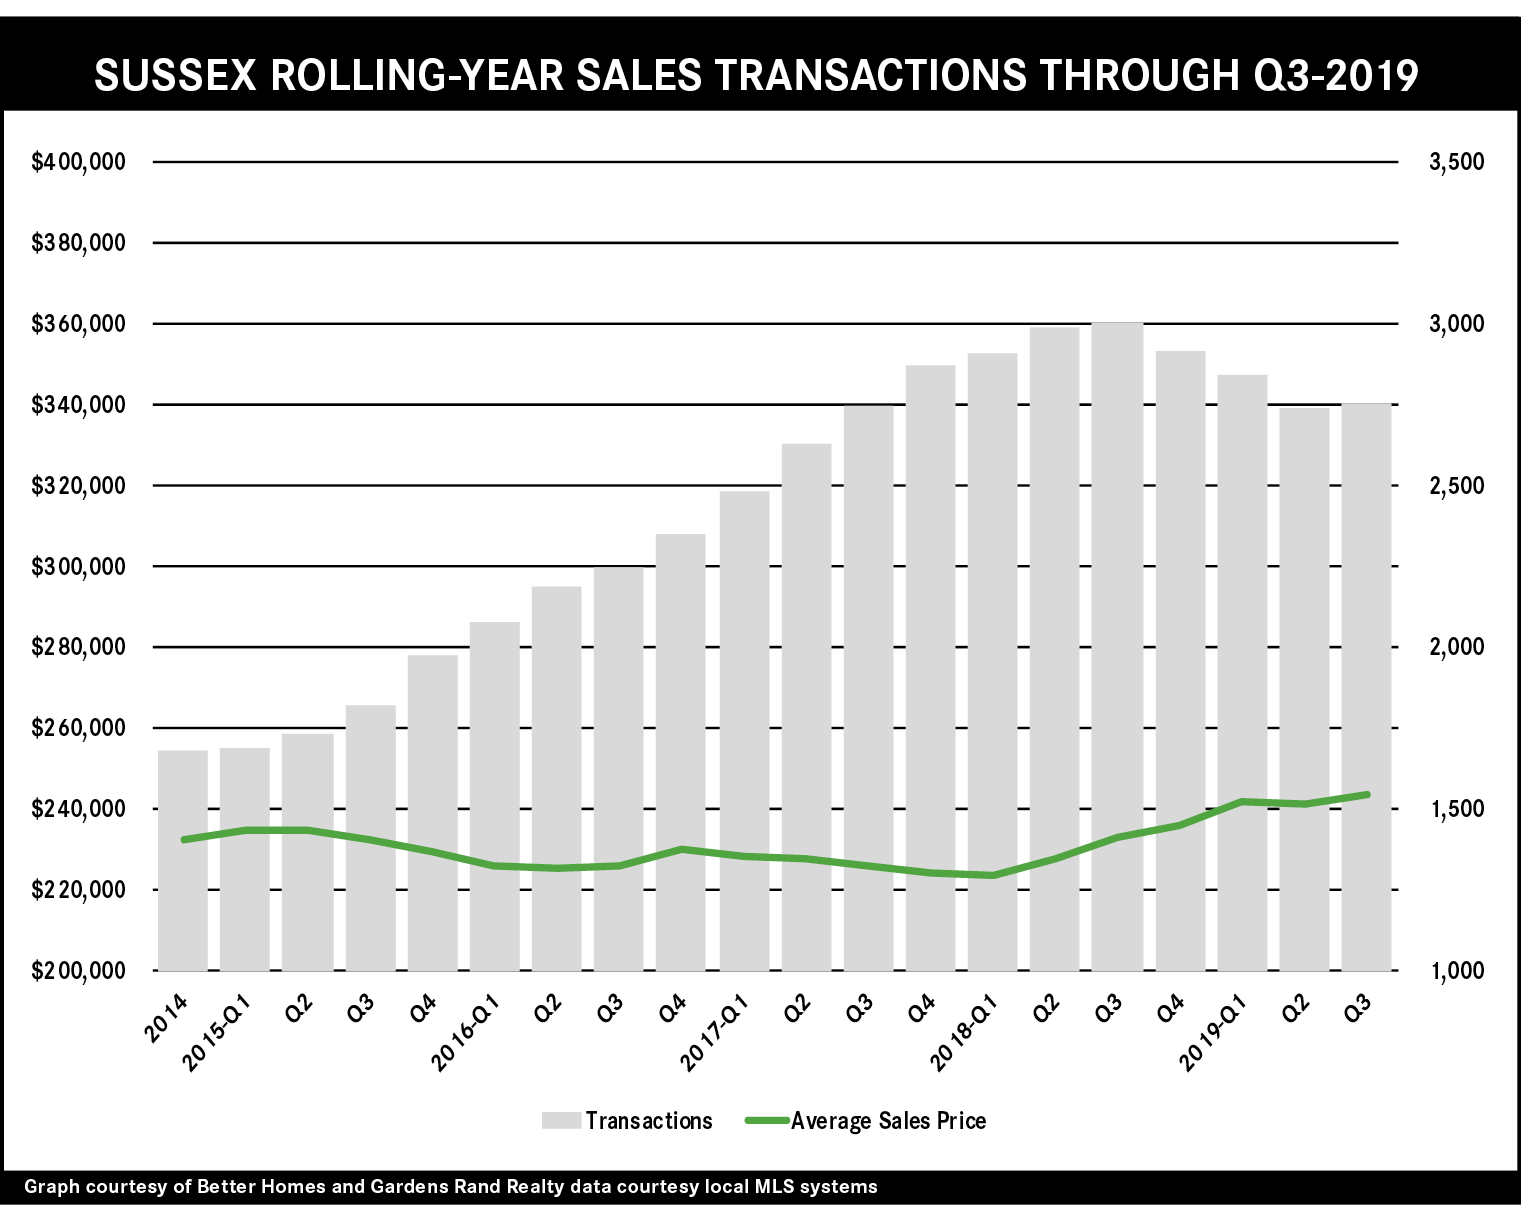
The Sussex County housing market showed significant signs of strength in the third quarter of 2019, with modest sales increases coupled with sharp price appreciation. Sales were up almost 2%, a welcome change from the past two quarters. Even with that quarterly increase, though, sales are still down over 8% for the rolling year. But the real story is pricing, which was up across the board: rising almost 3% on average and 8% at the median for the quarter, and finishing a rolling year up over 4% on average and 10% at the median. The other indicators support the theory that Sussex has moved into a seller’s market, with the days‑on‑market falling and the listing retention rate rising: homes are selling more quickly and for closer to the asking price, demonstrating that sellers are continuing to gain negotiating leverage with buyers. Going forward, we believe that the seller market fundamentals are strong: a growing economy, prices well below historic highs, low interest rates, and relatively low levels of inventory. So we expect to see continued appreciation and maybe even some sales growth through the winter and into 2020.
Third Quarter 2019: Real Estate Market Report – Hudson County, New Jersey
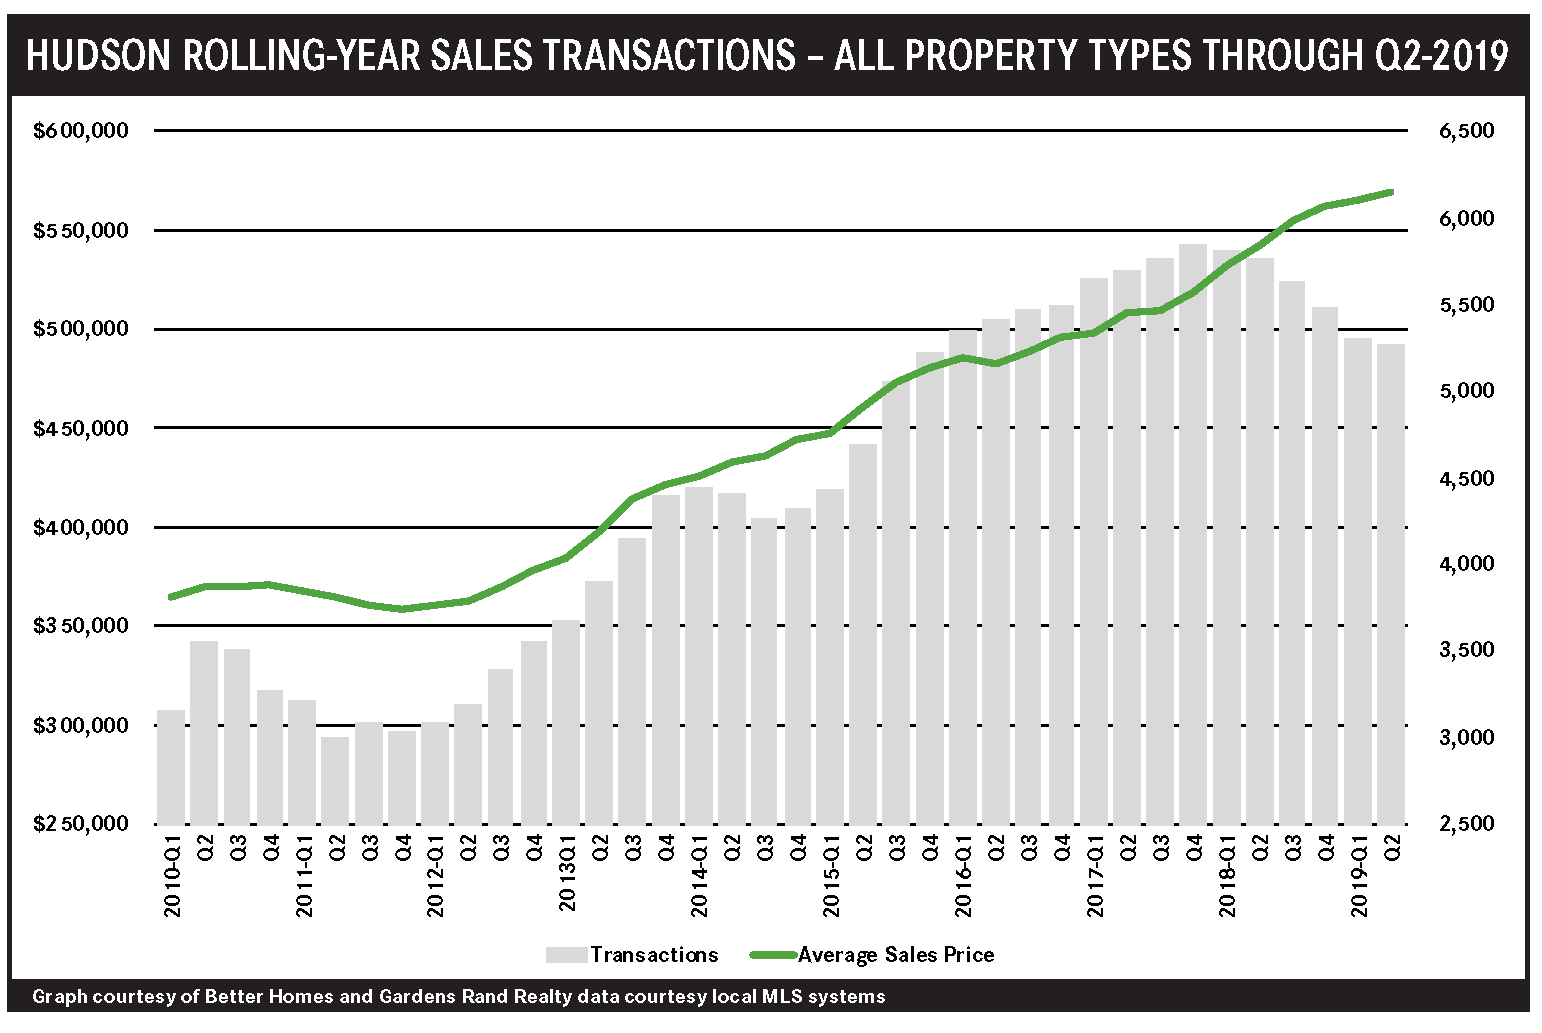
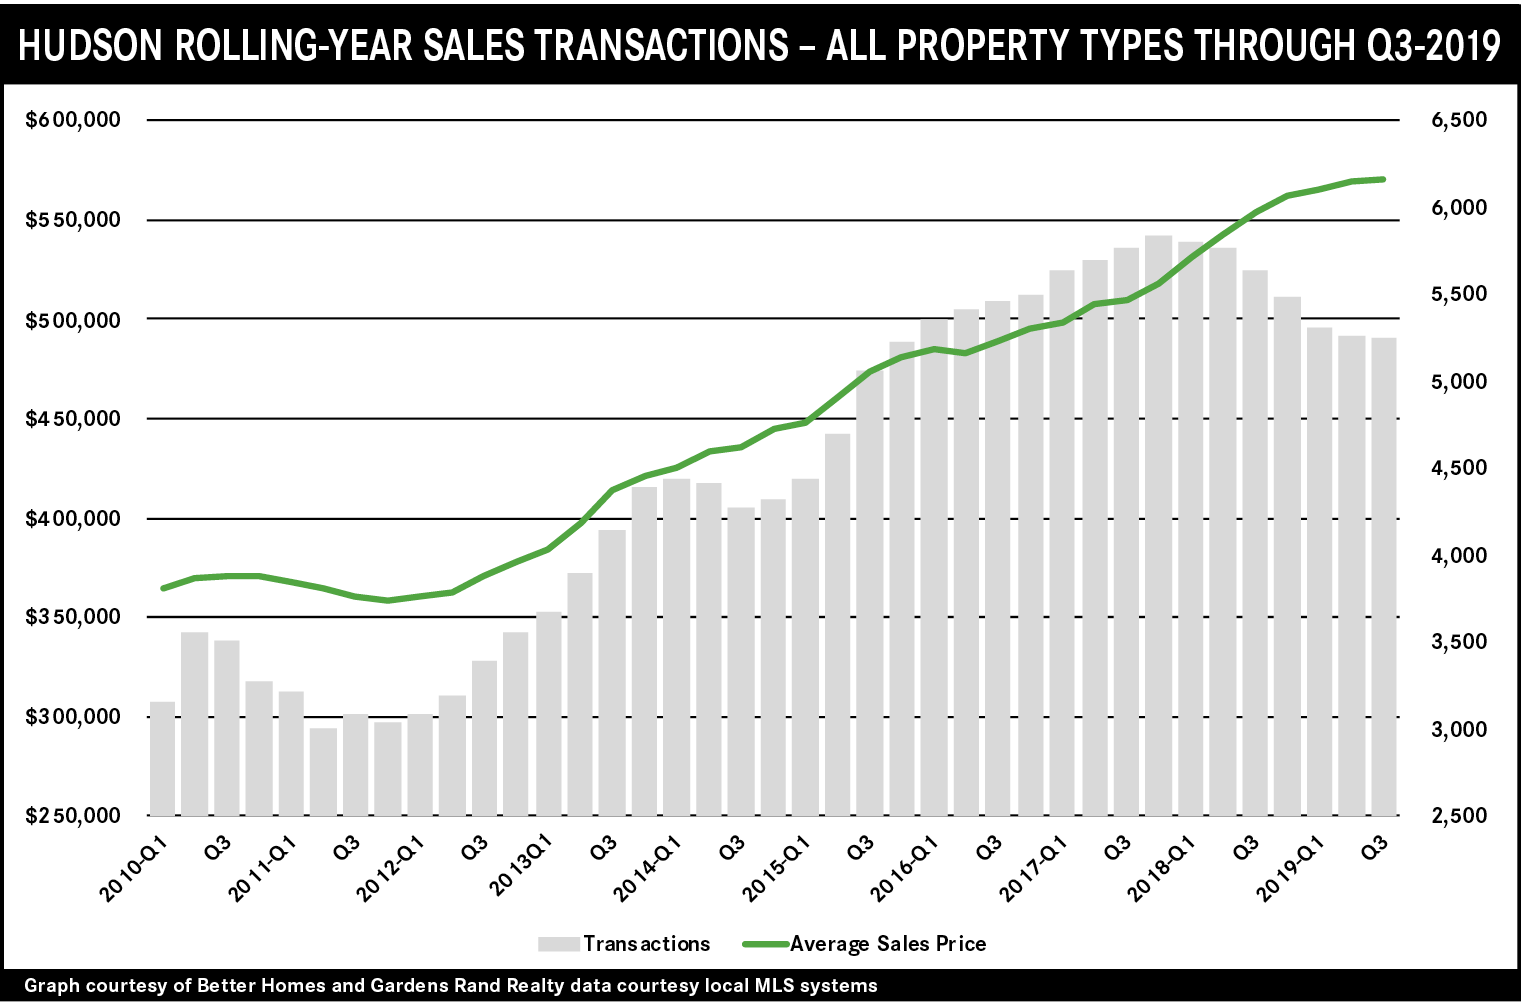
After sizzling throughout much of 2018, the Hudson County housing market continued its 2019 struggles through the third quarter. Sales were down almost 6% overall from last year’s third quarter, and are now down 6% for the rolling year. But even with this decline in sales, prices still appreciated modestly: average prices were up about 1% overall, rising almost 5% for single‑family homes and 7% for multi‑families, even while falling 2% for condos. We are clearly seeing some impact from the 2018 Tax Reform’s cap on state and local tax deductions (“SALT Cap”), which particularly affected higher‑income home buyers who are more likely to itemize their deductions. The SALT Cap is hampering Hudson both directly and indirectly: directly by reducing high‑end buyer demand in the county, and indirectly by slowing the exodus from Manhattan, which is suffering through the same SALT Cap impact. Going forward, though, we expect that the SALT Cap’s effects will eventually get priced into the market, and believe that the seller market fundamentals are strong: a growing economy, low interest rates, and relatively low levels of inventory. Accordingly, we expect to see sales level out and prices continue to appreciate through the winter and into 2020.
Third Quarter 2019: Real Estate Market Report – Bronx County, New York
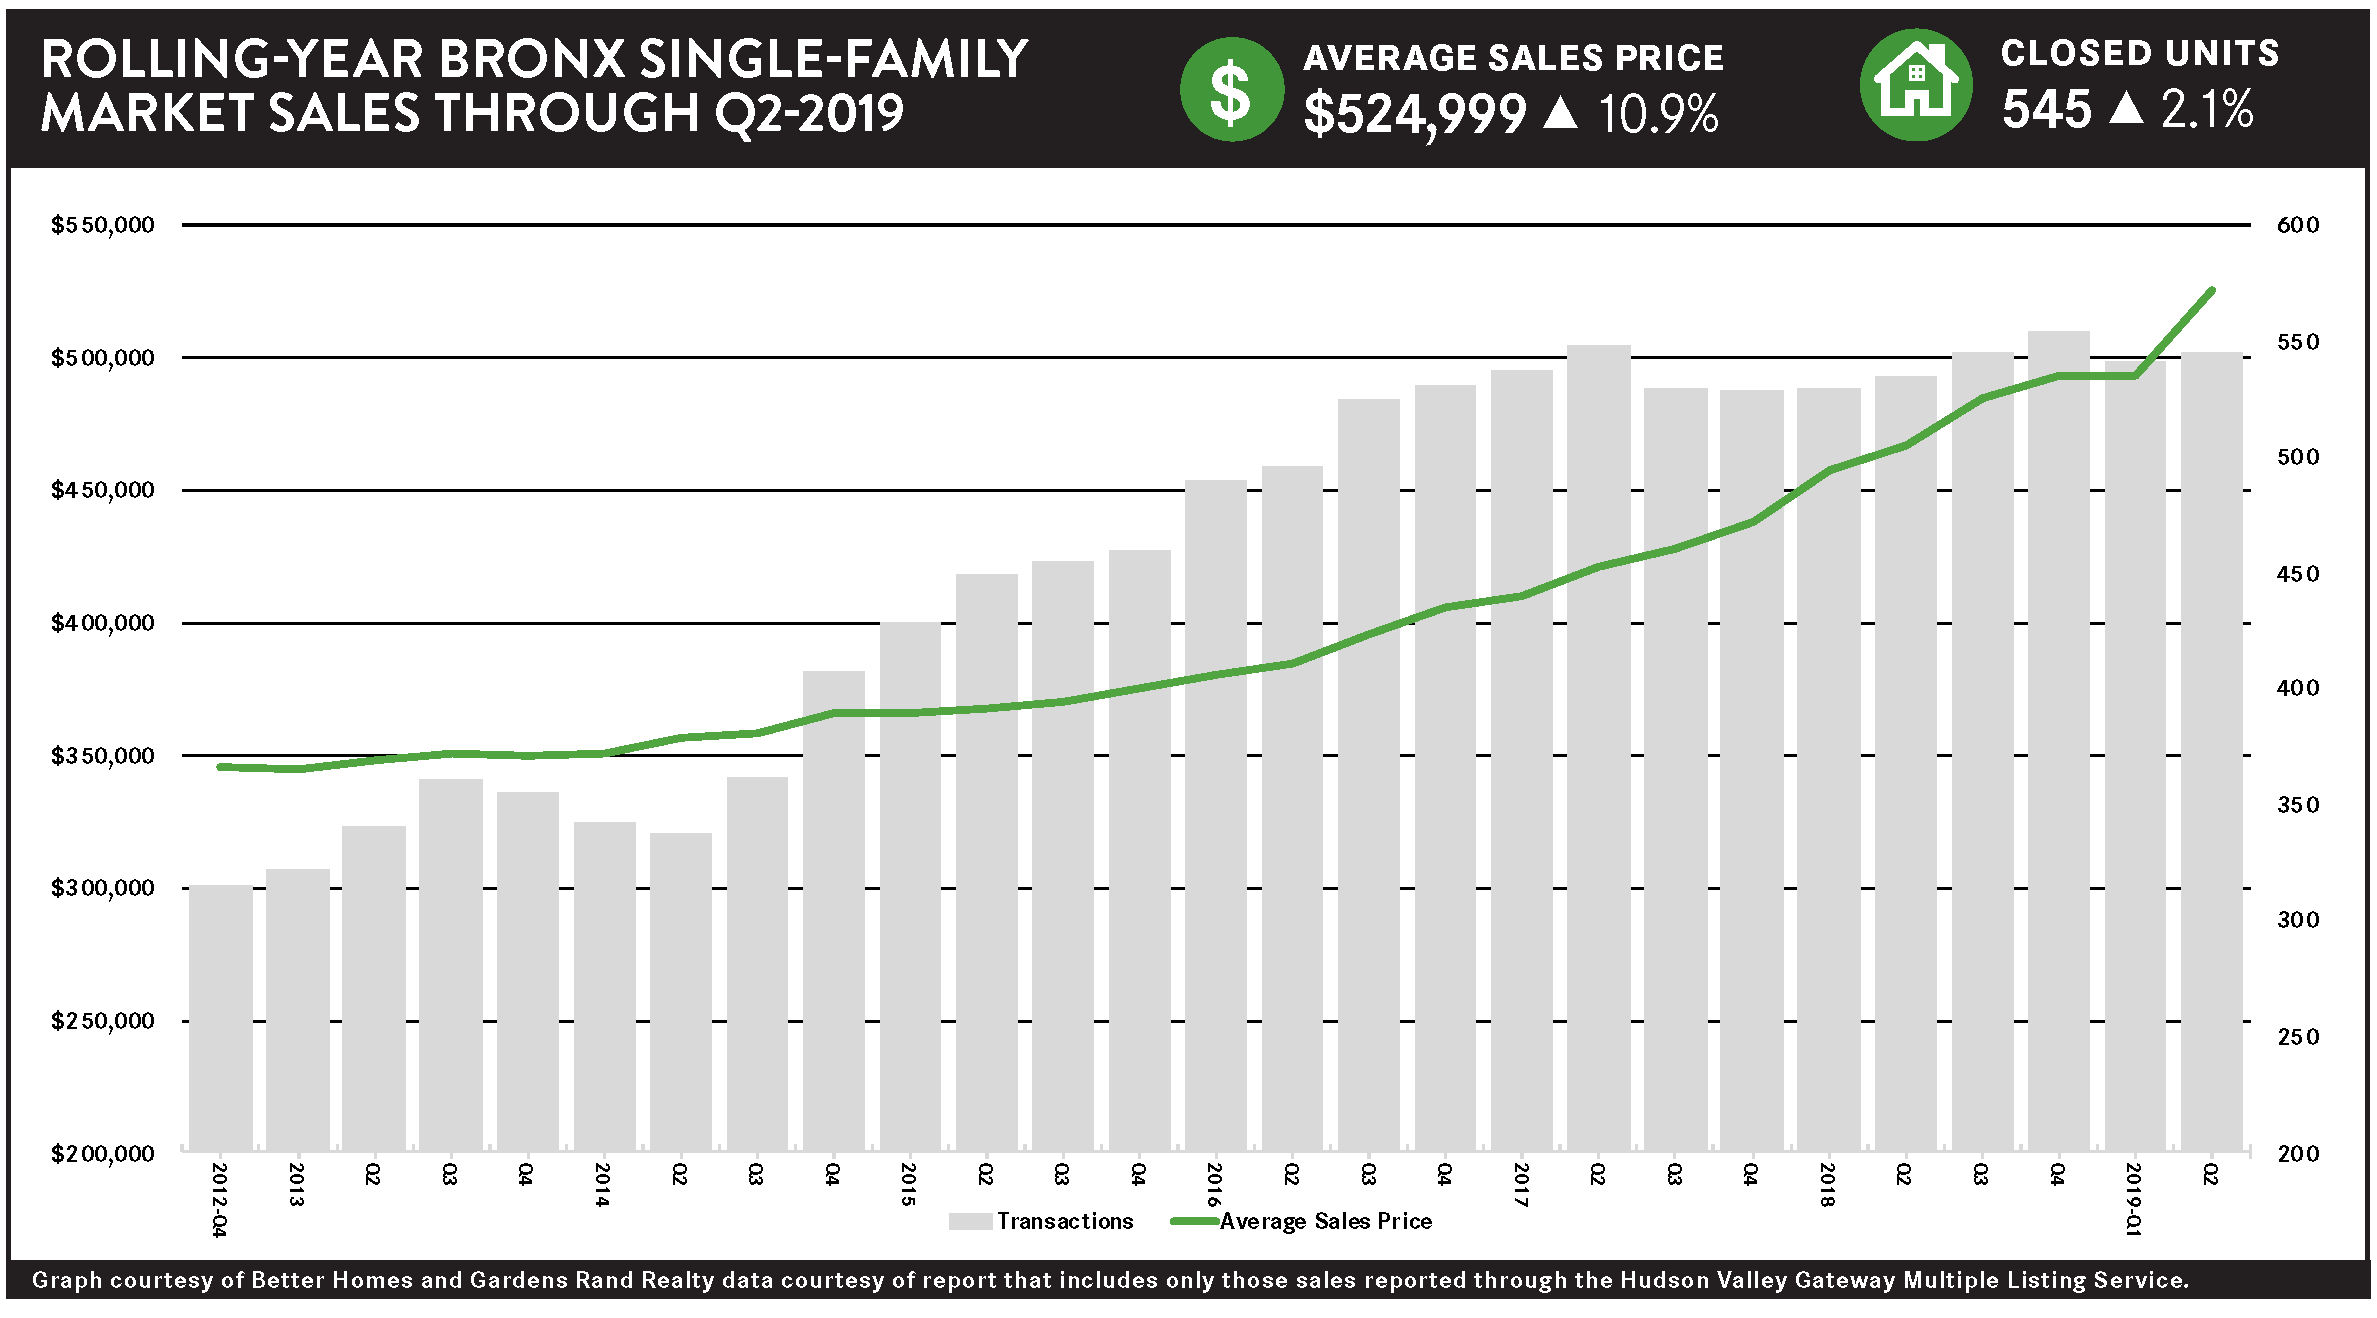
Pricing in the Bronx housing market surged again in the third quarter of 2019, as robust demand continued to push prices up even while a lack of inventory held sales down. Going forward, we believe that the fundamentals are strong, and expect a robust market through the winter and into 2020.
Pricing. Overall pricing was up over 6% compared to the third quarter of last year, and up for most property types: rising almost 10% for single‑family homes, 5% for multi‑families, and 4% for coops. The exception was pricing for condos, which fell about 7% for the quarter. For the rolling year, though, average prices were up for all property types, rising 11% for single‑families, 6% for multi‑families, 3% for coops, and almost 10% for condos. Demand in the Bronx is strong, which continues to push prices up.
Sales. Sales were more mixed, falling almost 7% compared to last year’s third quarter and now down almost 7% for the rolling year. Sales varied depending on property type: rising slightly for condos and single‑family homes but down sharply for multi‑families and coops. We believe that a lack of inventory is stifling sales throughout the borough: simply put, the Bronx lacks “fuel for the fire” to meet the demand for housing. That demand, coupled with low levels of inventory, is what is driving pricing up.
Inventory. The inventory challenges, though, might be easing. Inventory was up for all property types, probably because homeowners are attracted to the rising prices. Inventory is still in the 5‑6 month range for most property types, a level that usually indicates a seller’s market, but it’s definitely opening up a bit. That might start to push sales up in the fourth quarter.
Negotiability. The negotiability indicators – the listing retention rate and the average days‑on‑market – indicate that sellers are continuing to gain negotiating leverage with sellers. The listing retention rate was a little mixed, but the days on market were down for all property types, indicating that homes are selling more quickly – a clear sign of a growing seller’s market.
Outlook. Going forward, we believe that Bronx sellers and homeowners have reason to be optimistic about where the market is going. The fundamentals are very strong: the economy is growing, inventory is still low, interest rates are near historic lows, and demand is strong. We expect that, even with the challenges of a slowdown in Manhattan, the Bronx market will continue to see price appreciation and maybe even some sales growth through the winter and into 2020.
Third Quarter 2019: Real Estate Market Report – Westchester County, New York
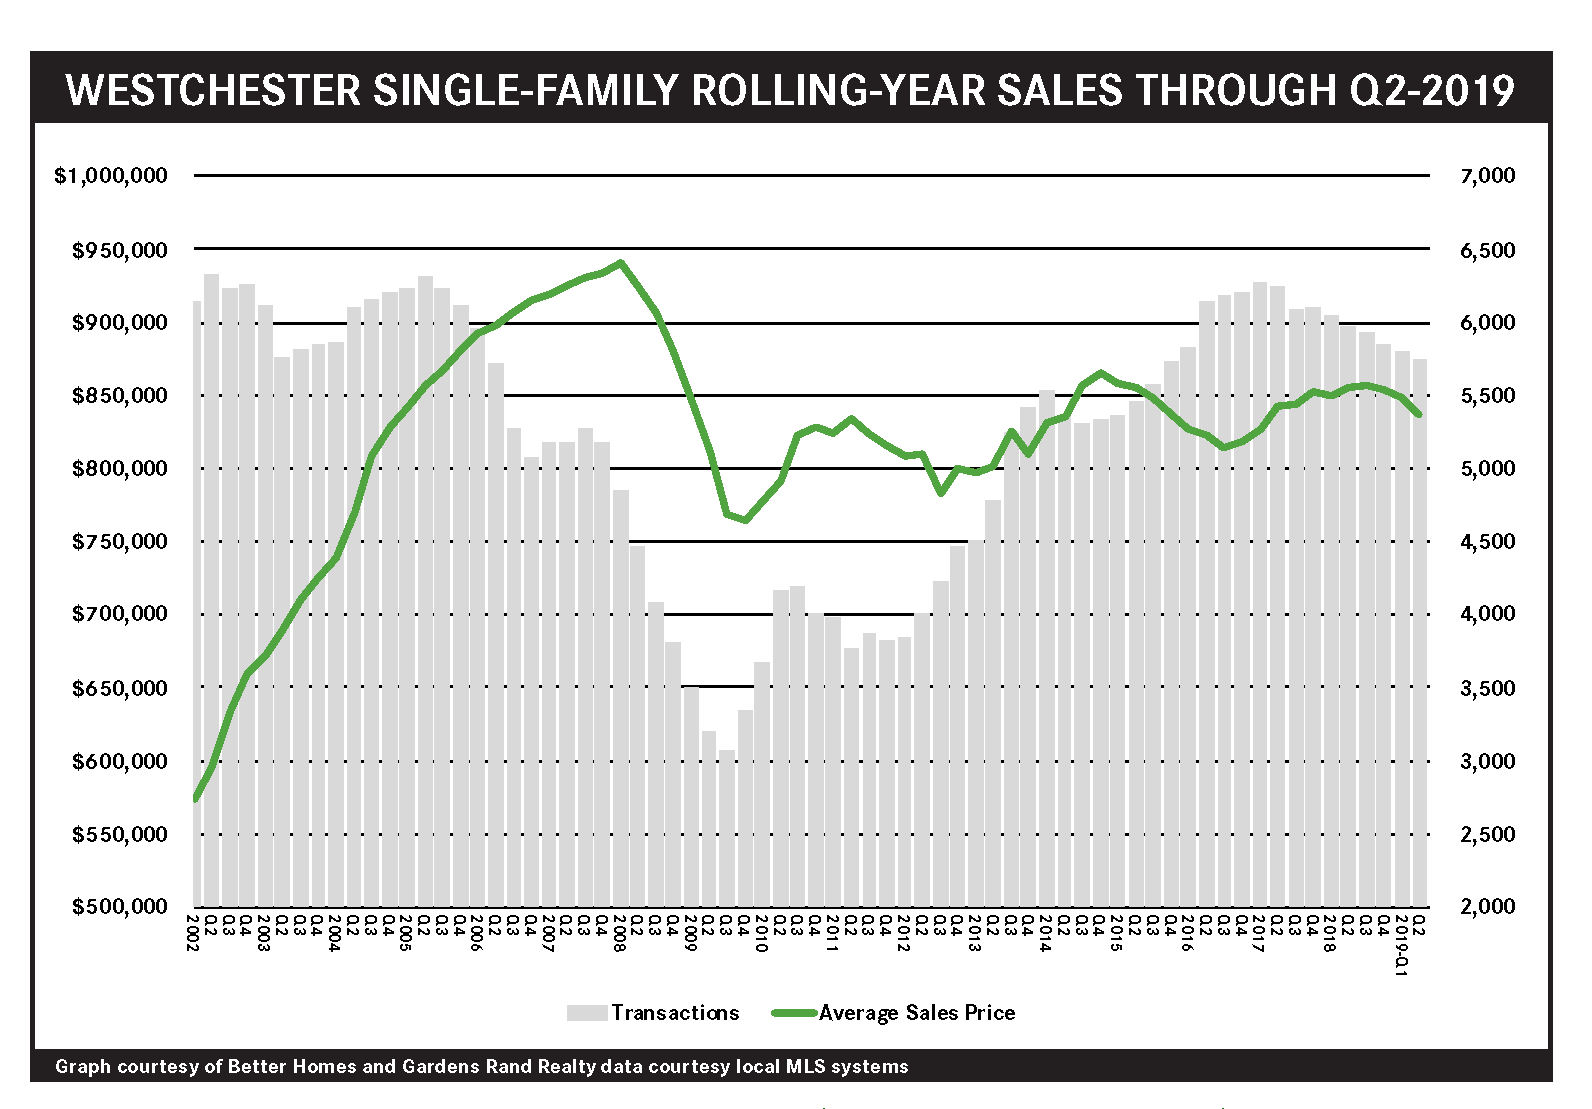
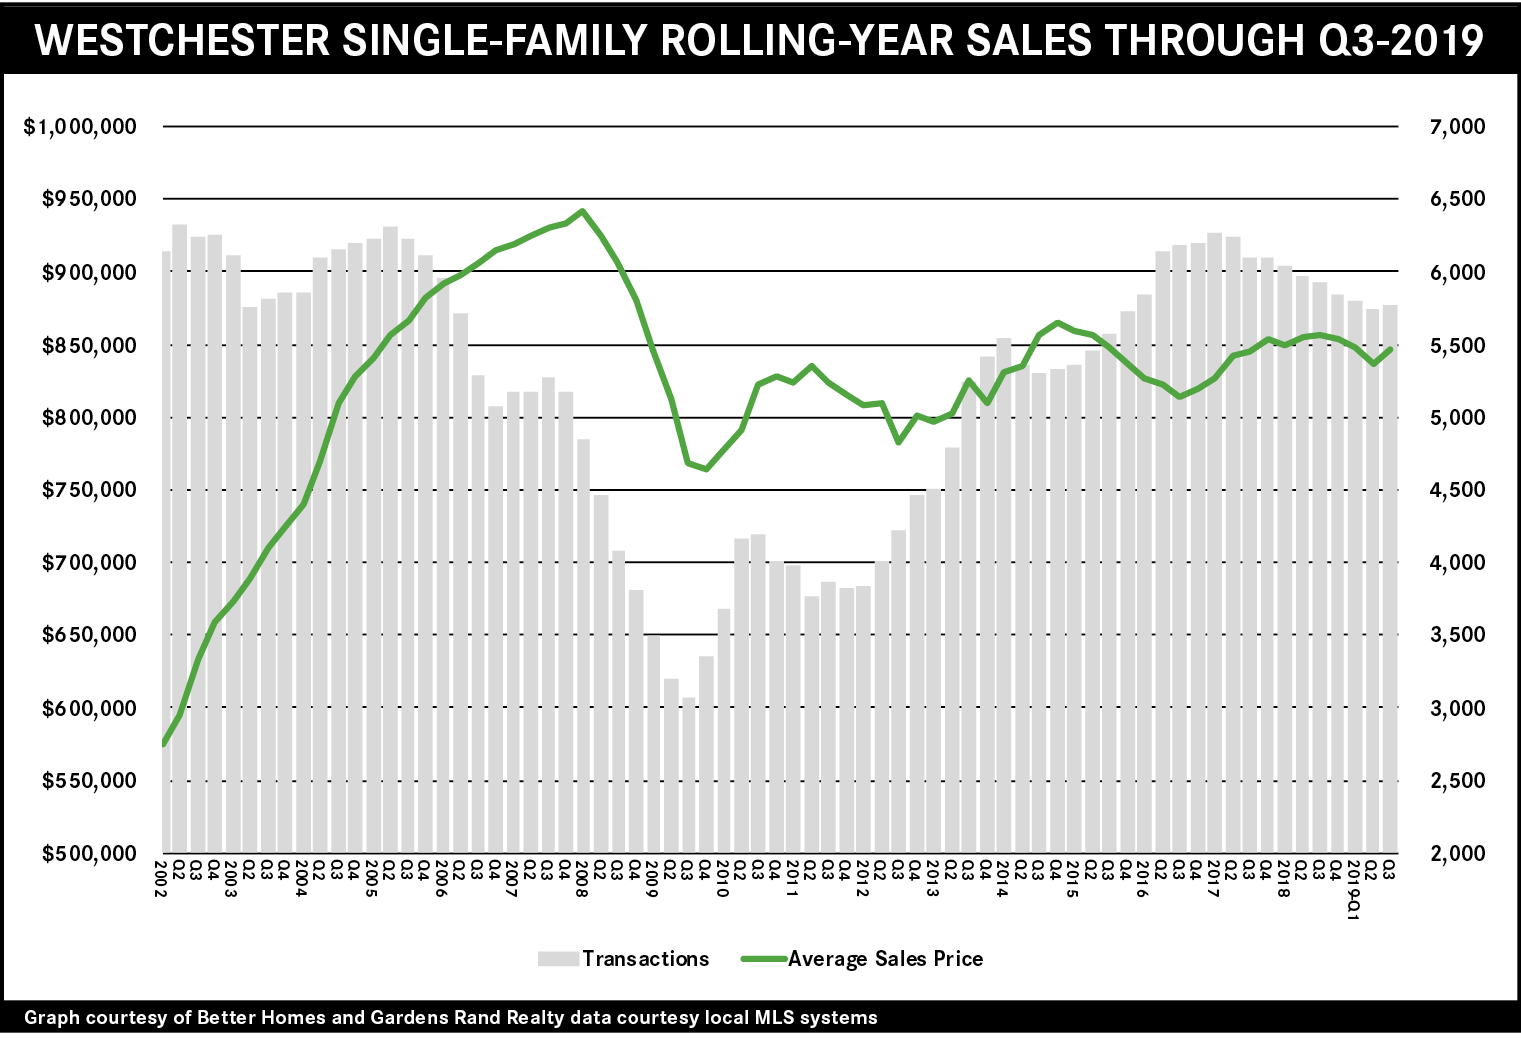
The Westchester housing market surged in the third quarter, showing signs of recovery from the lingering effects of the 2018 Tax Reform cap on state and local taxes (“SALT Cap”). Single‑family home sales were up about 1% compared to last year’s third quarter, the first year‑on‑year increase since the SALT Cap was passed. Similarly, single‑family average prices rose 3.3%, the largest quarterly appreciation since the inception of the SALT Cap. Moreover, the luxury market showed signs of life with 38 sales of $3M+ homes, an increase of almost 23% from last year’s third quarter, and the most quarterly sales in over four years. In the condo and coop markets, prices were also up significantly; sales results were more mixed, but only because inventory levels are down to about 3‑4 months. Basically, we believe that higher‑end home buyers are finally starting to price in the effects of the SALT Cap, and that the overall strength of the housing market – historically low rates, attractive overall values, and a solid economy – are going to continue to drive demand through the end of the year and into 2020.
Third Quarter 2019: Real Estate Market Report – Rockland County, New York
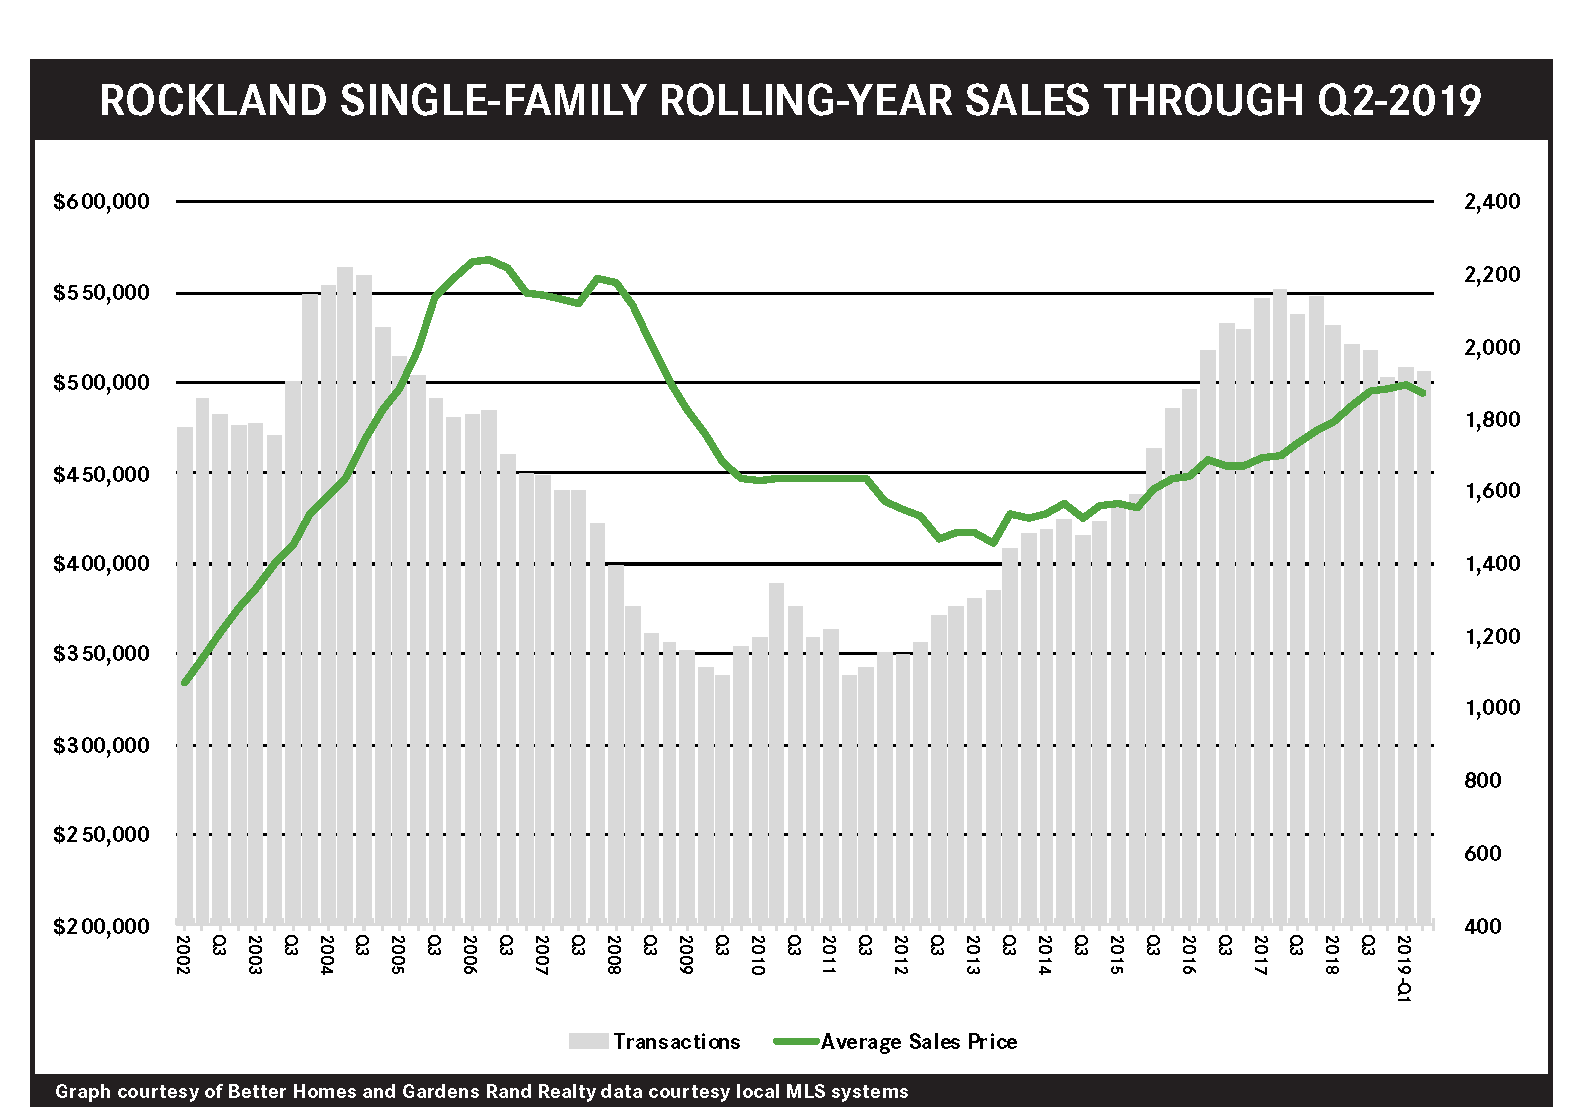
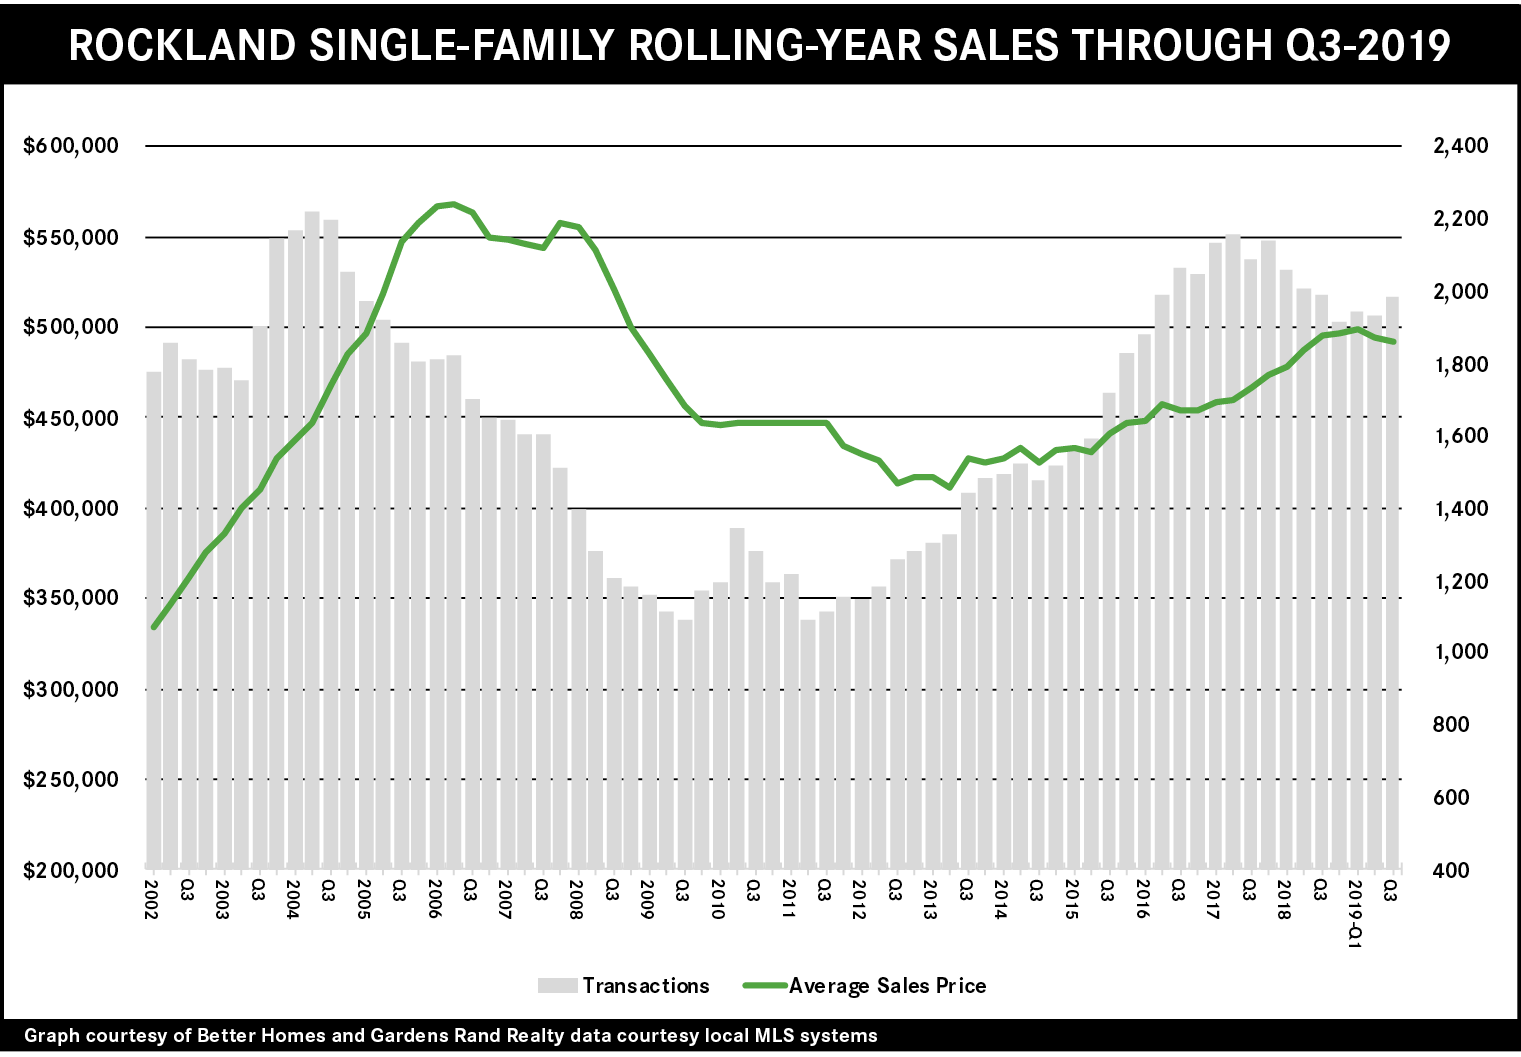
The Rockland housing market surged forward in the third quarter of 2019, showing the first signs of recovery from the lingering effects of the 2018 Tax Reform cap on state and local tax deductions (“SALT Cap”). Single-family home sales were up over 8% from last year’s third quarter, the largest increase since 2017, before the SALT Cap took effect. Pricing for the quarter was a little more mixed, with the median price rising over 3% but the average price down 1.5%, probably because the SALT Cap is still suppressing some demand in the high end. Indeed, if you look just at the condo market, which is priced well below the single-family market, you’ll see how strong demand is in the entry-level price points: prices in the quarter spiked over 13% on average and 12% in the median. Condo sales were down over 15%, but that’s largely due to a lack of viable inventory; demand remains exceptionally strong. Going forward, we believe that the SALT Cap is eventually going to get priced into the higher-end of the market, and that average prices will start to appreciate more aggressively by next year.
Third Quarter 2019: Real Estate Market Report – New York Overview
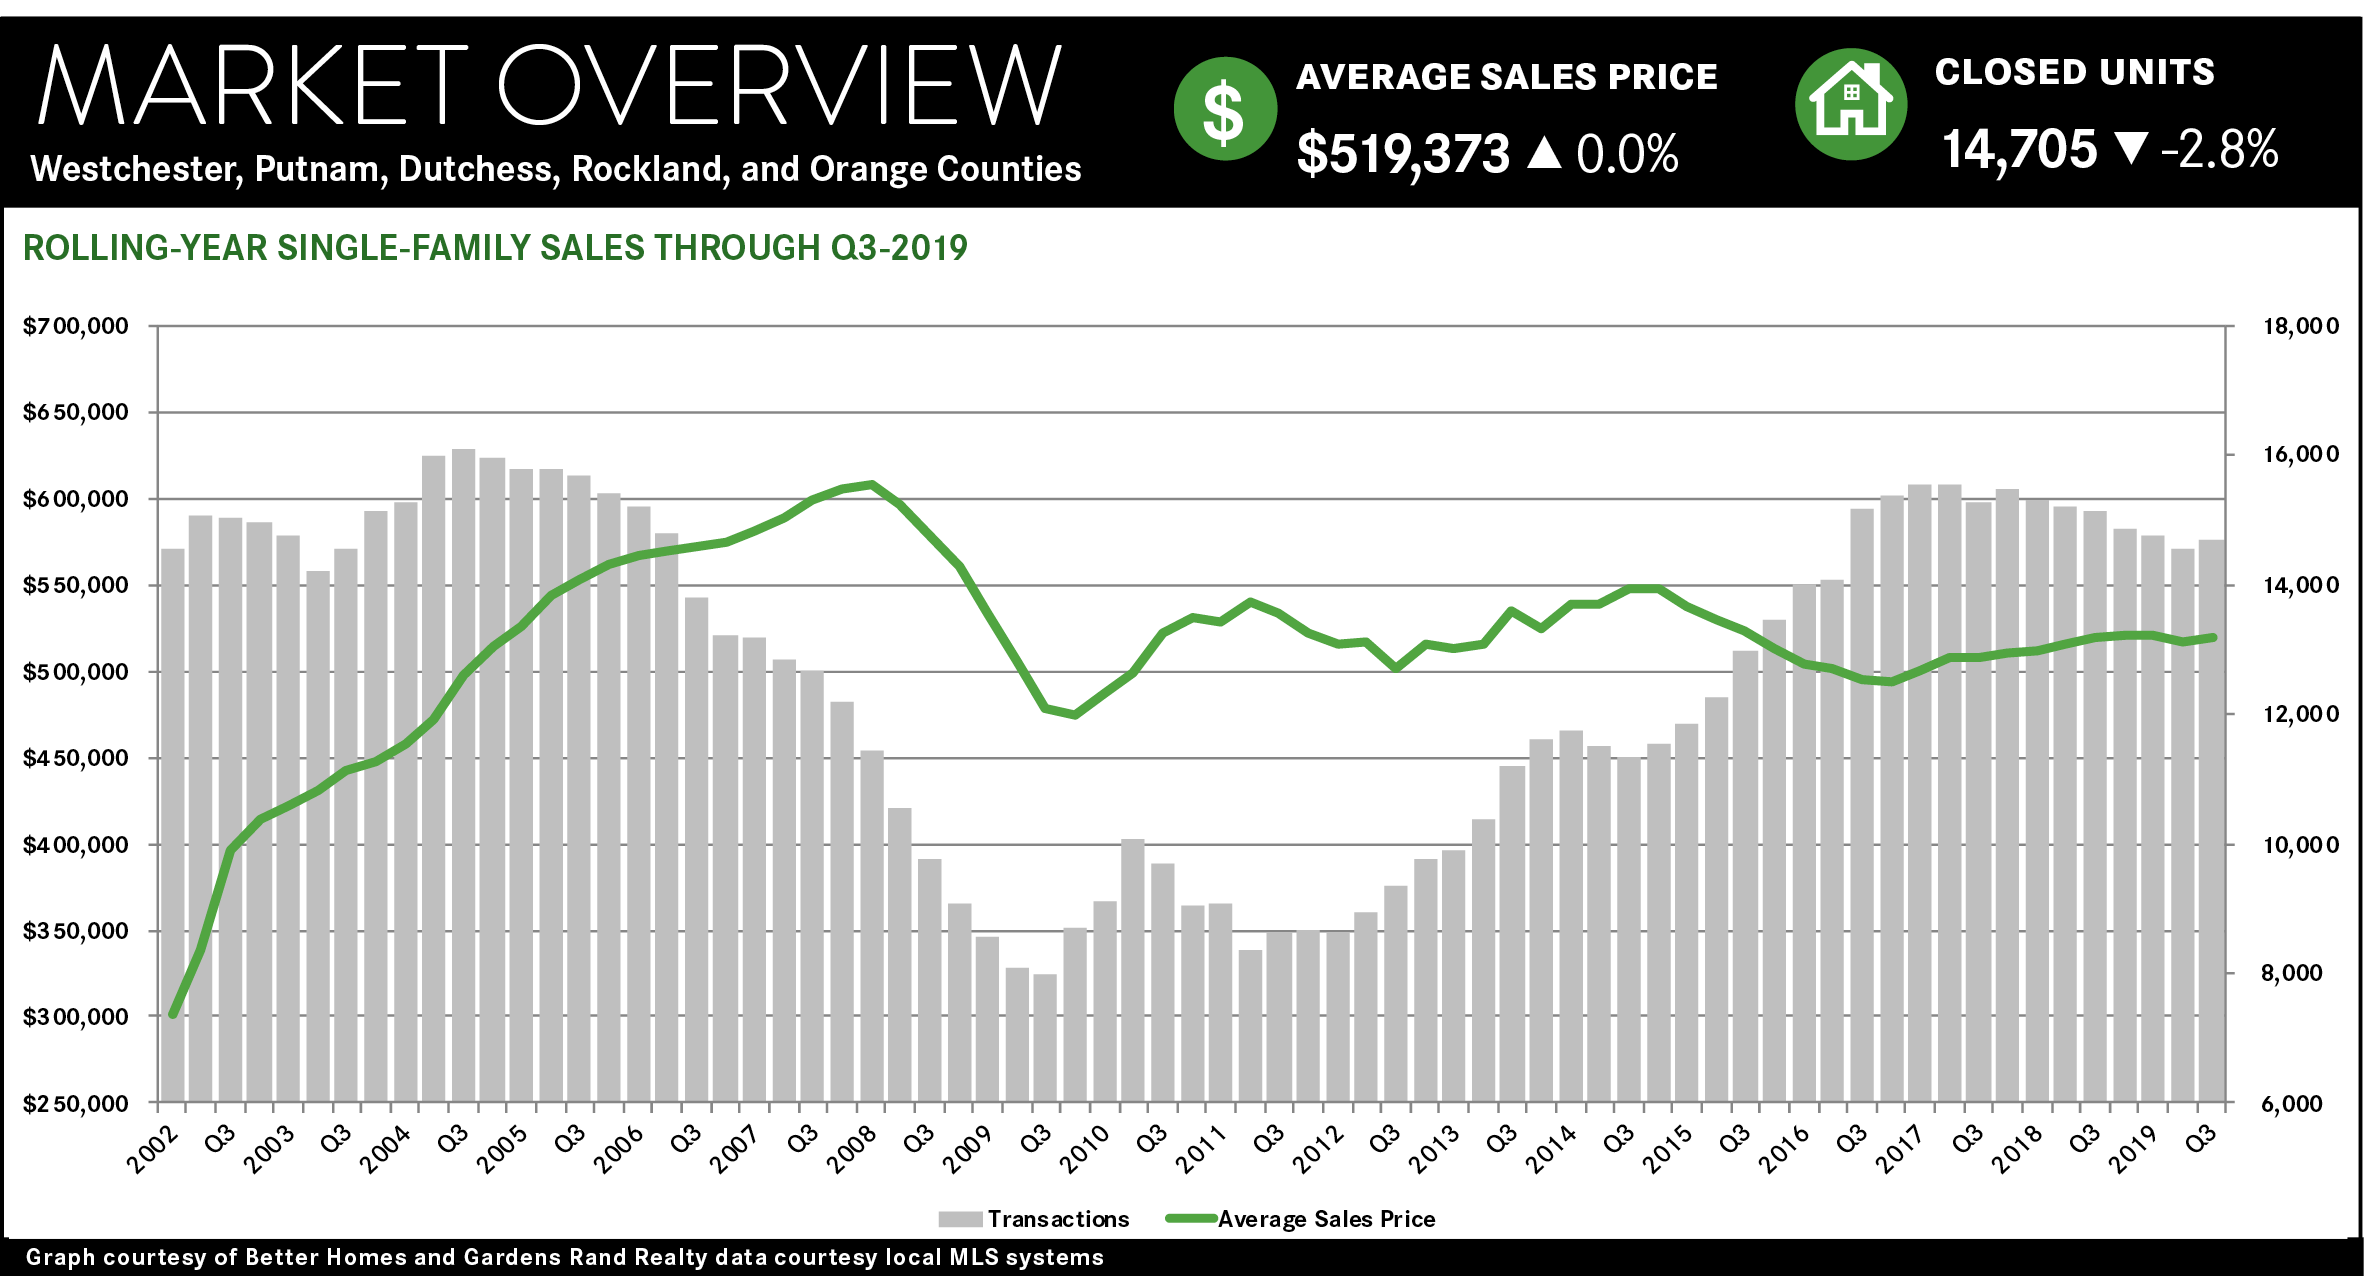
The housing market in Westchester and the Hudson Valley surged forward in the third quarter of 2019, showing the first signs of recovery from the suppressive effects of the 2018 Tax Reform Cap on State and Local tax deductions (i.e., the “SALT Cap”). With the higher‑end starting to recover, we expect the market will continue to strengthen through the fourth quarter and into 2020.
Single‑family sales were up regionally, and in every individual county. Regional sales rose 3.4% from last year’s third quarter, the first increase since the end of 2017 and the inception of the SALT Cap. Indeed, the 4,683 single family quarterly closings in the region was the highest total since the third quarter of 2017. Moreover, sales were up in every individual county, rising 1.2% in Westchester, 9.4% in Putnam, 8.2% in Rockland, 2.7% in Orange, and 3.7% in Dutchess. This surge in the third quarter moderated some of the declines earlier in the year, with the rolling year price flat and sales down 2.8%.
Similarly, single‑family prices were generally up across the region, reflecting some rising strength in the high‑end. Regionally, the average price rose 1.4% from last year’s third quarter, the first quarterly increase of 2019. Much of that was due to the first quarterly average price increase in Westchester since the inception of the SALT Cap. Indeed, we might be seeing a long‑awaited recovery in the high‑end Westchester market: sales of super‑luxury $3M+ homes rose 23% from last year’s third quarter, to the highest quarterly total in four years. That buoyed Westchester’s average sales price, which thus boosted the regional sales price.
In other counties, though, we saw signs of lingering weakness in the high end. Outside of Westchester, the Hudson Valley counties all saw a sharp divergence between the average and median sales price trends: in Putnam, the average down 0.2%, the median up 3.8%; in Rockland, the average down 1.5%, the median up 3.3%; in Orange, the average down 0.6%, the median up 4.7%; in Dutchess, the average up 5.4%, the median up 7.1%. Why was the median so much stronger than the average throughout the region? We believe that these markets have not yet priced in the SALT Cap impact on higher‑end homes, which is reducing the number of high‑priced sales and changing the mix of homes sold in a way that affects the average more than the median. Outside the very high‑end, which is still suppressed by the SALT Cap, the average Hudson Valley homeowner is probably experiencing fairly significant price appreciation.
Similarly, the condo and coop markets were torrid, with but prices spiking from a lack of inventory. Regionally, condo sales were down almost 3% from last year’s third quarter, and down a tick for the rolling year. But this is largely due to a lack of inventory, which remains well below the six‑month level that denotes a seller’s market. At the end of the quarter, inventory levels were at 3.3 months for Westchester coops, and at 4.1 months for Westchester condos, 5.3 months for Putnam condos, 4.7 months for Rockland condos, and 2.9 months for Orange condos. This lack of inventory is having its expected impact on pricing, with the regional condo/coop average price up almost 6% for the quarter and 7% for the rolling year, and rising in every individual county. Essentially, the lower‑end of the market has never been touched by the SALT Cap, so it’s simply experiencing the unfiltered effects of a robust seller’s market: low inventory that suppresses sales and boosts prices. This is what the entire market would look like had the SALT Cap never been enacted.
Going forward, we believe that the market is poised to finish the year strong. Housing fundamentals are all positive: prices are still at attractive levels compared to the last seller’s market, interest rates are back down to historic lows, the economy is solid, and inventory remains relatively low. Accordingly, we believe that strong demand will continue to grow, and that as the lingering effects of the SALT Cap dissipate, we will see more widespread price appreciation in the fourth quarter and into 2020.
Third Quarter 2019: Real Estate Market Report – Dutchess County, New York
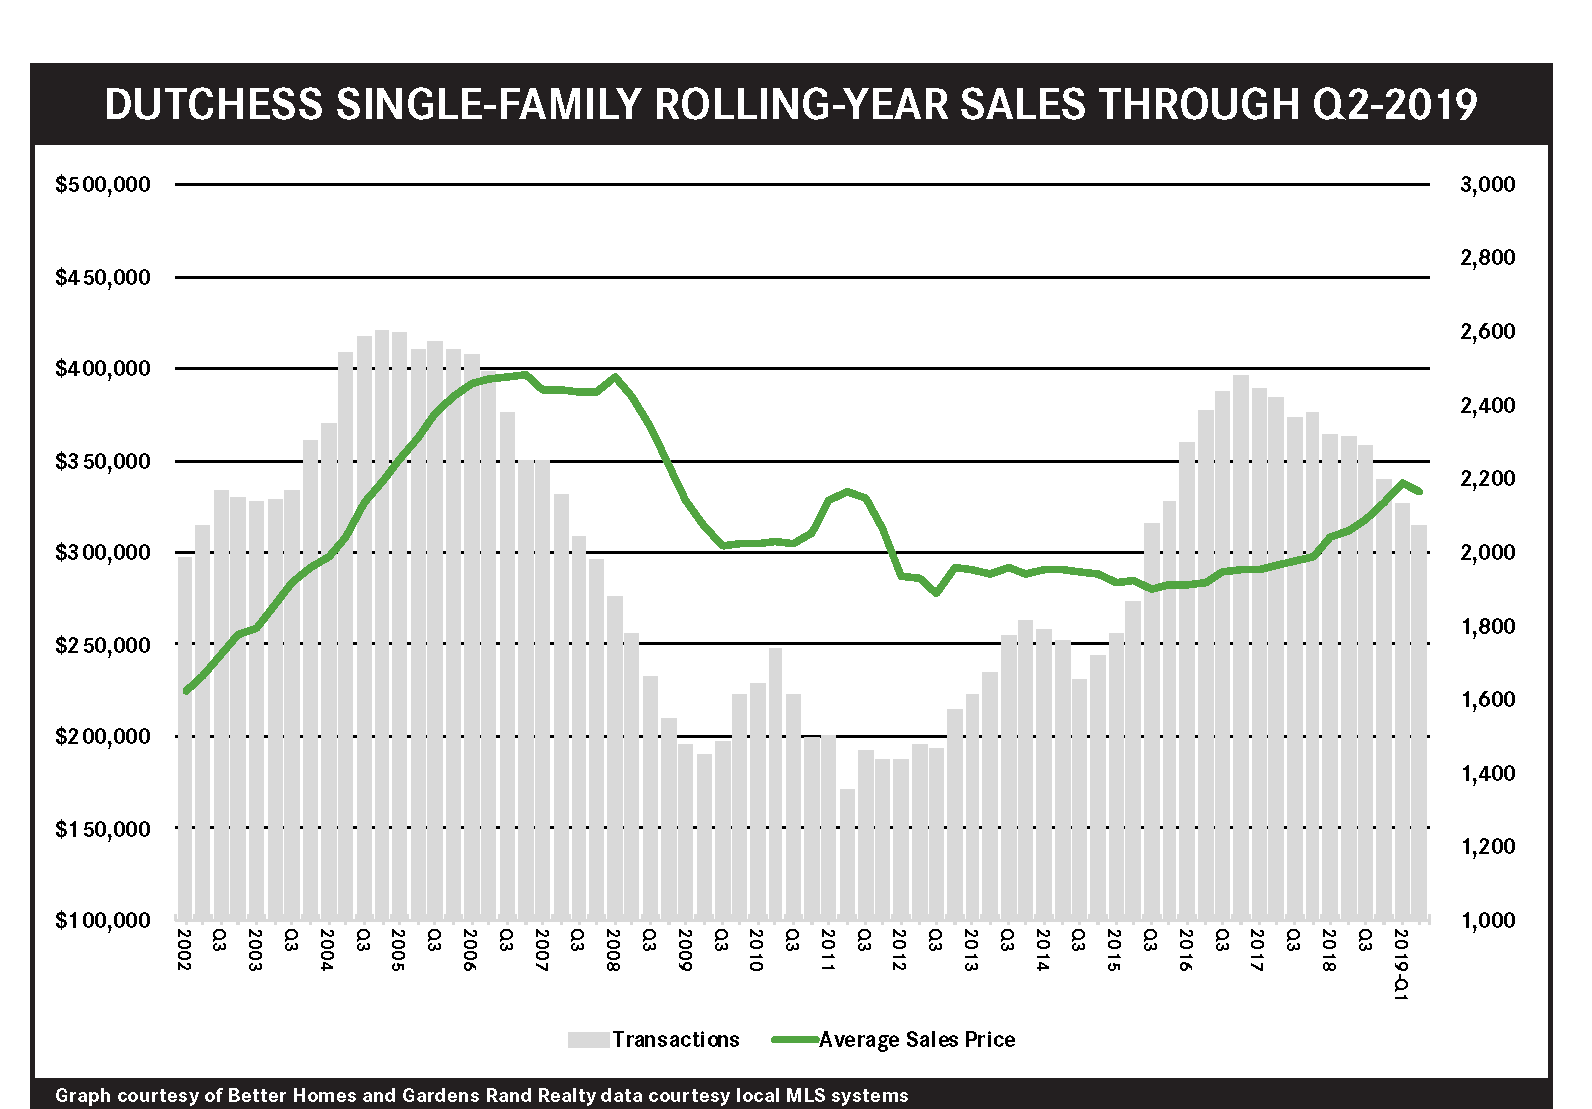
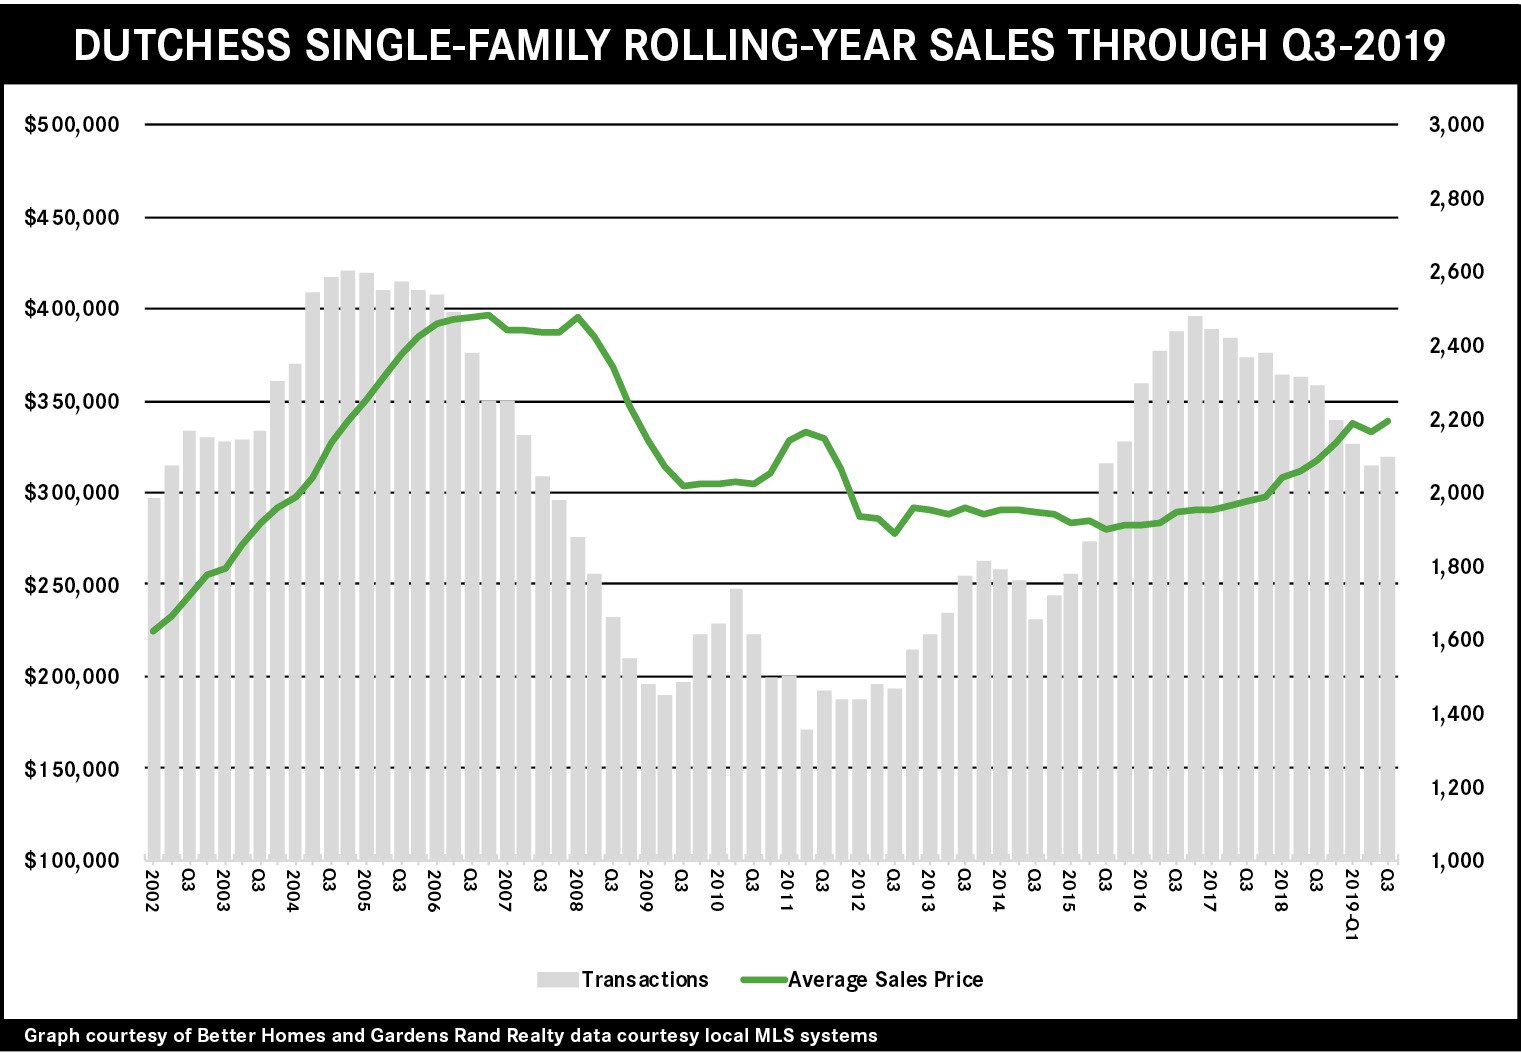
The Dutchess housing market surged in the third quarter of 2019, with sales and prices up sharply. Single-family home sales were up almost 4% compared to last year’s third quarter, the largest year-on-year sales increase in over two years. Indeed, the 671 closings marked the largest quarterly total since the third quarter of 2016. Similarly, single-family prices were up sharply, rising over 5% on average and over 7% at the median, with the rolling year average sales price now at its highest level since the fourth quarter of 2008 – at the tail end of the last seller’s market. In contrast, sales in the condo market were down slightly, but only because of a lack of inventory. Demand is still high, as evidenced in the rolling year pricing, with the average price up almost 5% and the median price rising almost 8%. Overall, we believe that the fundamentals of the market remain strong – demand is high, inventory is reasonably available, interest rates are near historic lows, and the economy is solid. Accordingly, we expect that Dutchess will continue to thrive through the end of the year and into 2020.
Third Quarter 2019: Real Estate Market Report – Putnam County, New York
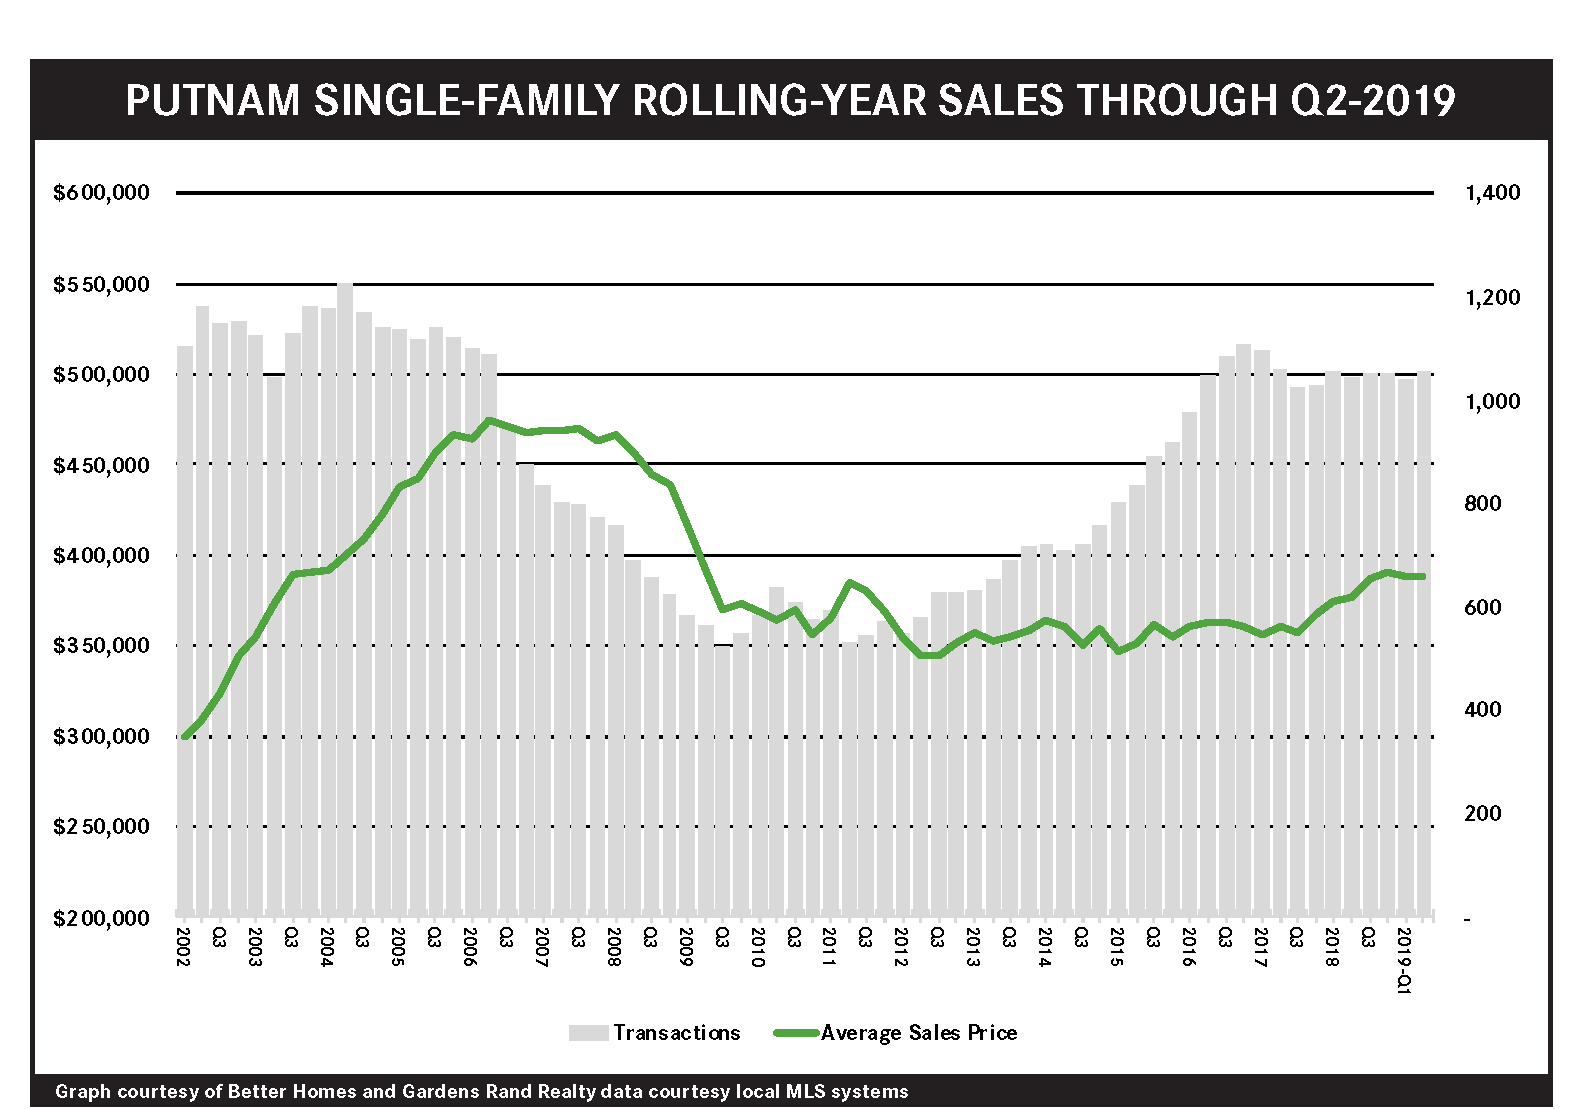
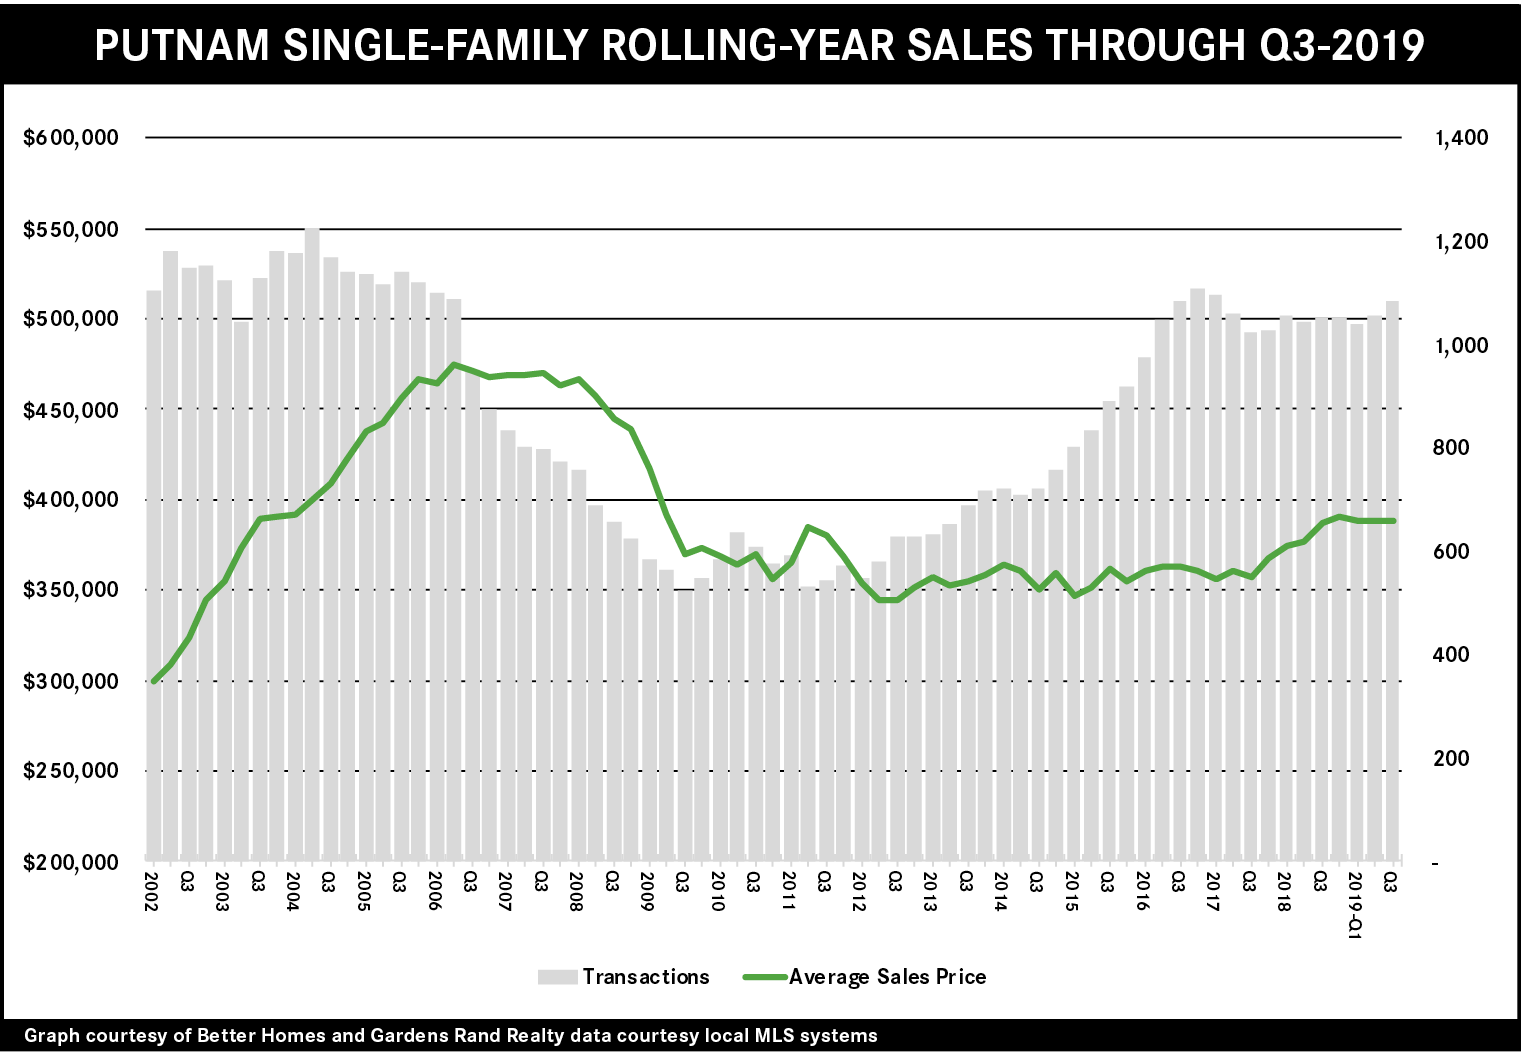
The Putnam housing market surged in the third quarter, with sales rising and prices generally appreciating. Single‑family sales were up over 9% compared to last year’s third quarter, with the 326 recorded closings marking the highest quarterly total in over three years. Pricing for the quarter was a little more mixed, with the median price rising almost 4% but the average price down a tick. Indeed, pricing for the rolling year showed the same divergence, with the median up over 5% but the average up only 0.3%. We believe that the discrepancy between the average and median has a lot to do with the suppressive effect of the 2018 Tax Reform cap on state and local tax deductions (“SALT Cap”) on the high‑end of the market, which is holding down the average even while the overall strength in the market buoys the median. This is good news for the average homeowner in Putnam (outside the highest‑end markets), who is likely experiencing significant price appreciation and a robust seller’s market. Moreover, we believe that the market is eventually going to price in the effects of the SALT Cap, which will boost the higher‑end of the market and probably drive more widespread price appreciation by next year.


